Monitoring Decisions
 PREVIOUS
NEXT
PREVIOUS
NEXT
| IBM ILOG Solver Debugger User's Manual > Debugging and Performance Tuning for Solver-based Applications > Visualizing the Search > Monitoring Decisions |
Monitoring Decisions |
INDEX
PREVIOUS
NEXT
|
You can use several visualization tools to monitor the decisions within your application: the Node Inspector, the Propagation Spy, the Decision Stack, or a tooltip on the Search Tree.
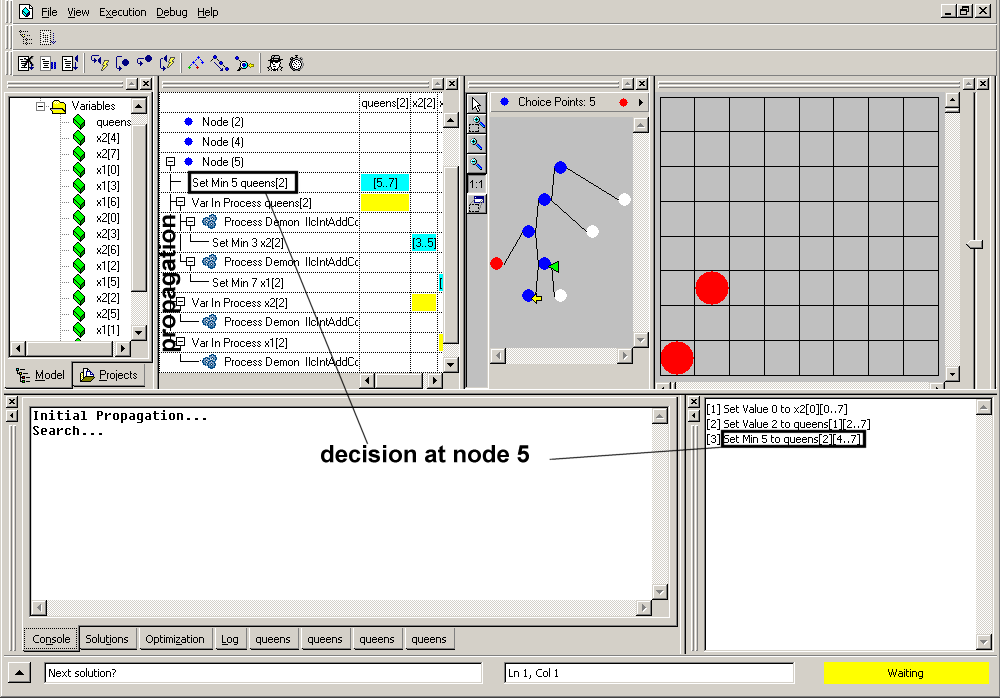
The interface shown above contains the elements used to monitor the decisions taken at each node in the search tree:
To use the Current Node Inspector docked panel, proceed as follows:
Right-click on a node to display the Node Inspector dialog box. In this dialog box, information on decisions taken at a node is only available when the exploration of the next node begins.
The Propagation Spy does not only contain the propagation events, it also contains the decision events.
| Note |
| In the current implementation, the monitored decisions cannot be distinguished from pushed constraints and optimization events. |
For information on how to use the Propagation Spy, see Using the Propagation Spy.
The Decision Stack is a panel that lists the decisions made in the current branch, starting from the root node.
When you double-click on a node, a green arrow points to the node you selected, and the Decision Stack (docked) panel displays the decisions taken in the branch starting from the root to the selected node. The description of the decision taken at a node is only available when the exploration of the next node begins.
The Decision Stack indicates the depth of the node starting from the root, displayed between brackets. For instance, in the debugnqueen example, [48] Set Value 47 to vars[94] corresponds to a decision taken at the node pointed to by the green arrow. [48] indicates the depth from the root.
| Note |
| Sometimes the last line is the only visible one. Even if the vertical scroll bar appears as full, previous lines do exist. To force scrolling up, drag the cursor up inside the text. |
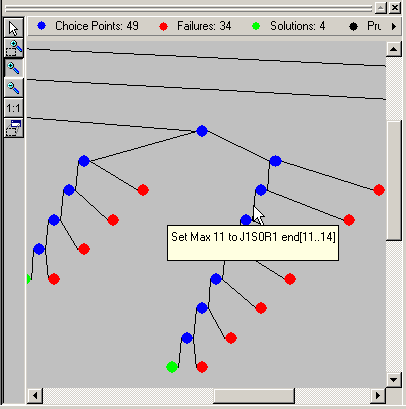
To access quickly the decisions taken at a node, place the cursor over the node graphic representation or over the link above. A tooltip will appear with the decision trapped by the debugger at this node.
| © Copyright IBM Corp. 1987, 2009. Legal terms. | PREVIOUS NEXT |