The Search Tree
 PREVIOUS
NEXT
| IBM ILOG Solver Debugger User's Manual > Debugging and Performance Tuning for Solver-based Applications > Visualizing the Search > The Search Tree |
The Search Tree |
INDEX
 PREVIOUS
NEXT
|
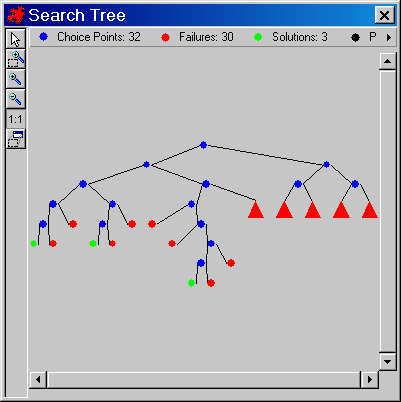
When you first launch an execution, a drawing of the tree appears node by node in the Search Tree viewer. If necessary, interrupt the execution with the Break button. The Debugger will stop at the beginning of a node visit.
If you previously closed the search tree views you can redisplay them by selecting the menu item View > View Search Tree, or by clicking on the corresponding button  in the tool bar.

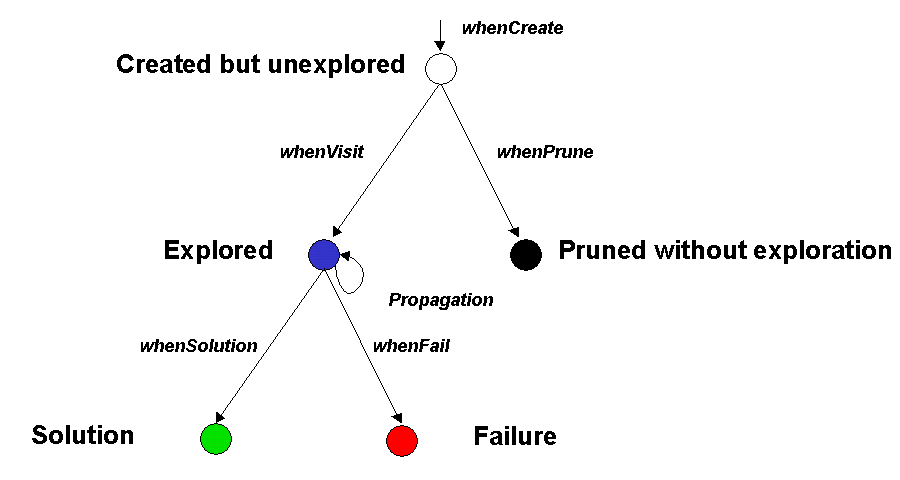
There are five node colors that correspond to the status of a node in the Search Tree, as shown in the graphic below:

While the yellow arrow points to the root node, the algorithm is performing the initial domain reduction and the Initial Goal successively.
Right-click on a node to:
Use Search Tree mode selectors to choose the view you want for the Search Tree.


| © Copyright IBM Corp. 1987, 2009. Legal terms. | PREVIOUS NEXT |