Using the Propagation Spy
 PREVIOUS
NEXT
PREVIOUS
NEXT
| IBM ILOG Solver Debugger User's Manual > Debugging and Performance Tuning for Solver-based Applications > Visualizing Propagation > Using the Propagation Spy |
Using the Propagation Spy |
INDEX
PREVIOUS
NEXT
|
The Propagation Spy is a means of displaying the trace of events and the result of the propagation in terms of domain reduction. The Propagation Spy provides a graphical representation of events trapped by the IlcTrace and IlcSchedulerTrace mechanisms.
See the IBM® ILOG® Solver and IBM ILOG Scheduler documentation for details on these two classes.
The Propagation Spy is a special hierarchical sheet containing a tree hierarchy in the first column. Each column contains the impact on one variable. Time is represented vertically, from top to bottom. The textual description of the events is displayed in the first column. When double-clicking on an event line, the columns are rearranged so that a variable of interest is displayed first.
The figure below shows what the tracing of the Initial Propagation for the Pheasants and Rabbits problem (debugpheasant) looks like in the Propagation Spy.
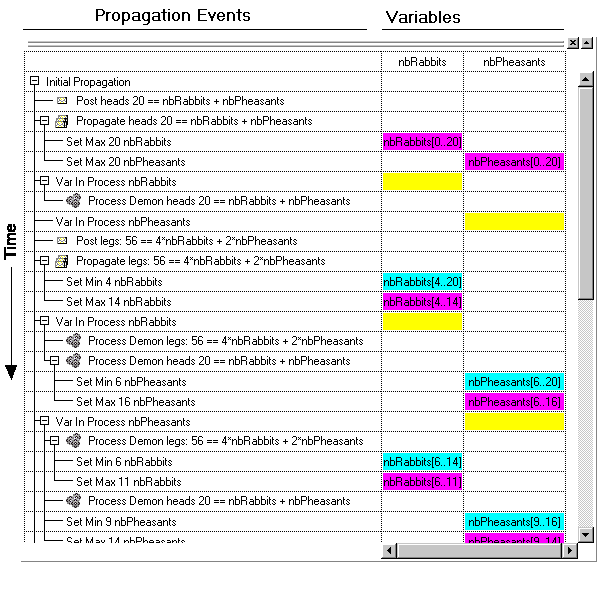
The cell at the junction of an event line and a variable column is colored according to the type of event and shows the result of the event in a textual form. You can follow the history of the domain reduction in that cell.
The correspondences between cell colors and the event types are:
| © Copyright IBM Corp. 1987, 2009. Legal terms. | PREVIOUS NEXT |