Multiple Agents/k-hop Diffusion |
We measure the effectiveness of MobEyes harvesting process according to
two performance indicators: the summary harvesting latency, i.e.,
the time for an agent to harvest summaries generated by regular nodes; and the
summary diffusion latency, i.e., average time to deliver a random summary to
the agent (this is the average value of the cumulative distribution of the
summary harvesting by the agent).
To enhance the validity of our conclusions, it is important to determine
the dependence of the indicators on different mobility models.
For every mobility model, we show plots for 1-3
agents and for 1-3 relay hops (k).
The summary harvesting latency is a crucial figure to determine the feasibility of the MobEyes approach,
since it allows us to estimate the fraction of harvested summaries by the agent within a certain time t.
This estimation is useful to decide the tuning of the parameters (k and number of agents) to address
application requirements.
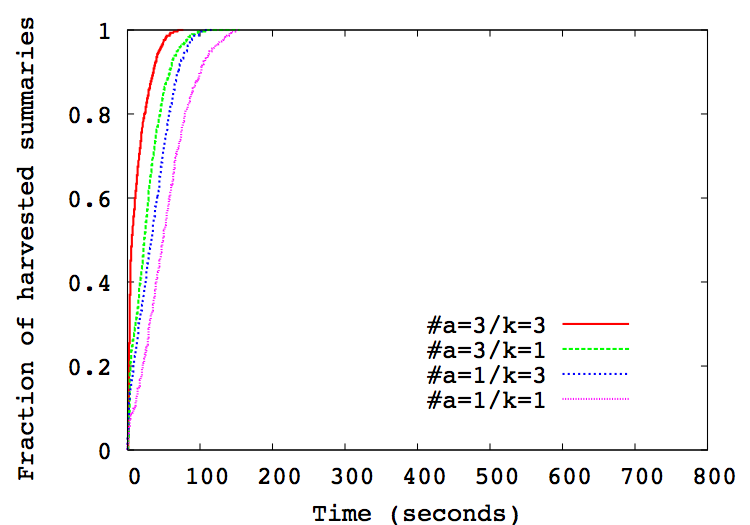
The following Figures show how
the number of agents, the choice of the number of relaying hops k, and
the average speed v of the nodes influence the process.
These figures plots the cumulative distribution of the summaries harvested
for N=300, v=15. In the case of multiple agents, the
harvesting process considers the union of the summary sets harvested by agents.
The figure clearly shows that k-hop relay scope and
multiple agents highly impact harvesting latency.
By carefully inspecting the results in these figures and those for
a=1, k=1,
it is possible to obtain some guidelines about the effect of MobEyes parameters.
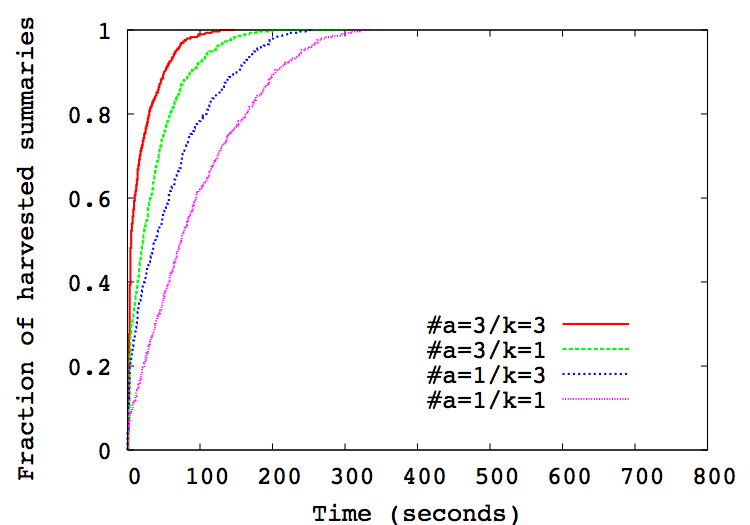
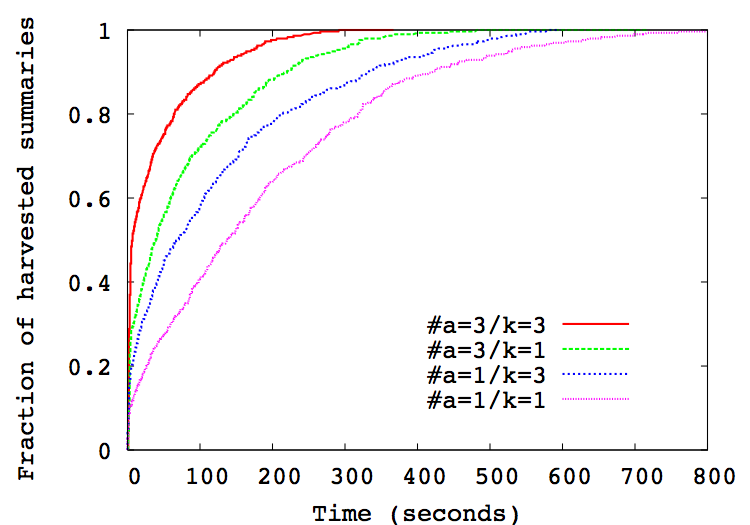
For example, given as a baseline a network with N=300 nodes moving
with an average speed v=15m/s, fixed k=1,
a single agent employs 530s, 236s, and 116s to harvest 95%
of the summaries generated respectively in RT, MAN and RWP mobility models.
By increasing k to 3, times respectively reduce to 420s,
176s, 86s, showing an improvement of about 20-30% in all cases.
Instead, increasing the number of agents to three,
times become respectively 280s, 123s, and 68s; in this case, the improvement
is in the range 40-50%.
Finally, if we set v=25m/s, times become 211s, 67s, and
43s; the improvement is around 60-70%.
Interestingly, the impact of the three parameters shows a limited
dependence on the mobility model. This holds also for the results we collected
for different cases (i.e., different values of N and v): in particular,
speed has a larger impact than the number of agents, and k is the less
decisive factor.
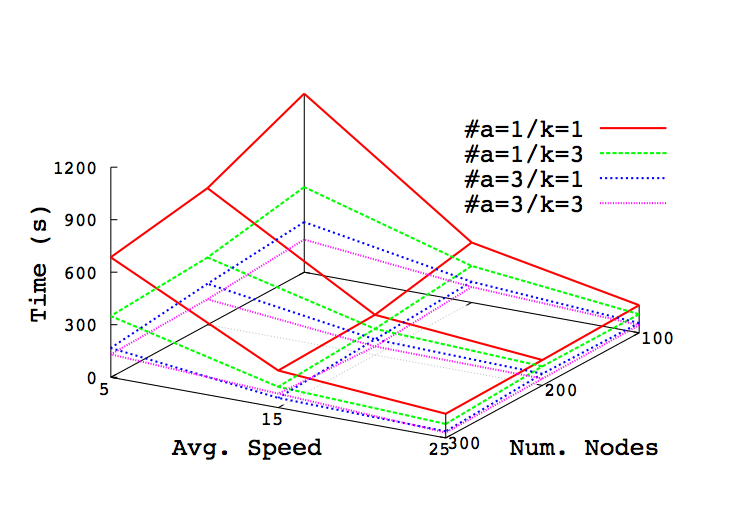
These observations are further confirmed by the results in Figure~\ref{fig:avgharvest2}.
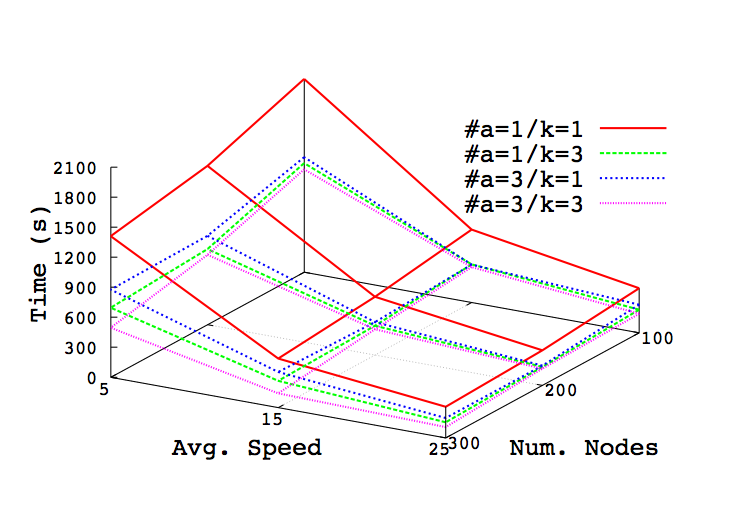
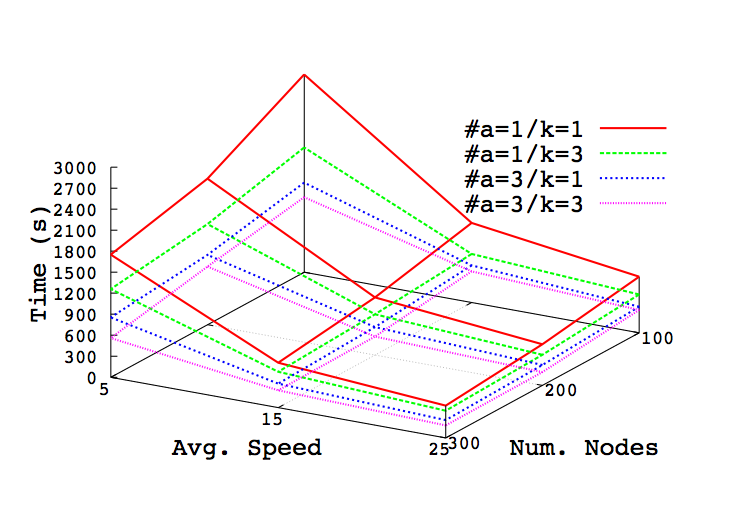
The second important indicator describing the effectiveness of MobEyes harvesting process
is the summary diffusion latency. Next figures report the results we obtained for the cases of
one and three agents, k=1,3, N=100-300, and v=5-25.
Similar conclusions to the case of summary harvesting latency can be
easily drawn. Again, average node speed v and number of deployed agents
show a larger impact on latency than the number of relay hops k.