Describe
 PREVIOUS
NEXT
| IBM ILOG Solver User's Manual > More on Solving > Setting Filter Levels: Coloring Graphs > Describe |
Describe |
INDEX
 PREVIOUS
NEXT
|
In this lesson, you will solve a graph coloring problem. Graph coloring problems may seem like puzzles, but they have many applications in industry, including scheduling, testing circuit boards, and assigning frequencies for radio and phone communications.
A graph is composed of nodes. Nodes that must be different colors are connected by lines, called edges. A clique is a set of nodes where every node is linked to every other node by an edge.
These concepts will become clearer if you re-examine the map coloring problem you solved in Chapter 2, Modeling and Solving a Simple Problem: Map Coloring. Map coloring problems can be represented as graph coloring problems. Each country on the map is a node. Nodes (countries) that must be colored different colors are linked by lines or edges. See Figure 12.1.
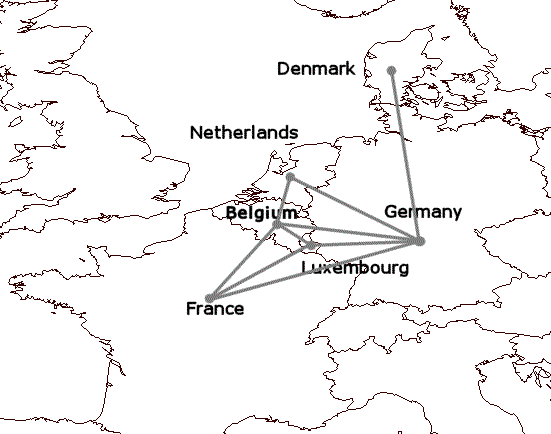
The nodes are Belgium, Denmark, France, Germany, Luxembourg, and the Netherlands. Each pair of neighboring countries is connected by an edge, indicating that these two countries cannot share the same color. There are many cliques. For example, France, Luxembourg, and Germany are all linked to each other by edges. They form a clique; Luxembourg is linked to Germany, Germany is linked to France, and France is linked to Luxembourg. However, France, Belgium, and the Netherlands do not represent a clique; France is linked to Belgium and Belgium is linked to the Netherlands, but France and the Netherlands are not linked to each other.
Two types of cliques, maximal cliques and the largest clique, are interesting for this lesson. A maximal clique is a clique such that no other clique contains it. For example, Germany and Denmark form a maximal clique, because no other clique contains Denmark. Another maximal clique is Germany, France, Luxembourg, and Belgium. Another is Germany, Belgium, and the Netherlands. The clique Germany, Luxembourg, and France is NOT a maximal clique because the clique Germany, Luxembourg, France, and Belgium contains it.
The largest clique is simply the clique containing the largest number of nodes. In this example, the largest clique is Germany, Luxembourg, France, and Belgium.
To convert this map coloring problem into a graph coloring problem, you can extract the nodes and edges from the map as shown in Figure 12.2. The problem is now to color the nodes in such a way that no pair of nodes connected by an edge are the same color.
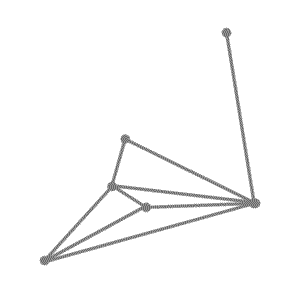
You can solve this graph coloring problem by using the answers you found for the map coloring problem in Chapter 2, Modeling and Solving a Simple Problem: Map Coloring. Belgium is blue; Denmark is blue; France is white; Germany is yellow; Luxembourg is green; and the Netherlands is white.
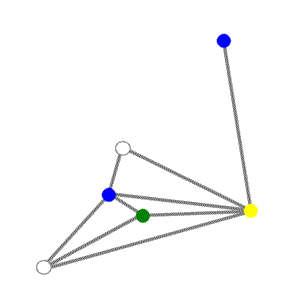
Many real world problems can be represented as graph coloring problems. In general, the graph represents items and the edges represent incompatibilities between items. The problem is to find a way to color the graph so that each incompatible pair is colored different colors, ideally using the fewest possible colors.
For example, the problem of assigning frequencies is essentially a graph coloring problem. In its simplest form, you have a set of frequencies and customers who use these frequencies, for example, in a cell phone. Customers who are located within a certain distance of each other cannot share the same frequency--cannot be the same "color"--or there will be interference. Customers who are farther apart in distance can share the same frequency--can be the same "color." The problem is to find a solution using the fewest number of frequencies--"colors"--while avoiding any interference.
Now that you understand the basic concepts in graph coloring problems, here is the problem description for this lesson. You will solve a graph coloring problem for a special kind of graph. This graph has n*(n - 1)/2 nodes, where n is an even number. Every node belongs to exactly two maximal cliques of size n - 1.
There is a theorem that states that the minimum number of colors needed to color a graph so that two nodes that are linked by an edge are different colors is greater than or equal to the size of the largest clique. In this problem, the largest clique is the same size as the maximal cliques of size n - 1. Therefore, the minimum number of colors needed to color this graph is greater than or equal to n - 1. You will try to color the graph with n - 1 colors and see if it is possible.
For example, if you have a graph with n = 4, there are 6 nodes or 4 * (4 - 1)/2. Every node belongs to exactly two maximal cliques of size 3 or 4 - 1.
Here are the maximal cliques:
Here is a diagram with the nodes and maximal cliques. The nodes are node 0, node 1, node 2, node 3, node 4, and node 5. The edges of clique 0 are blue; the edges of clique 1 are black; the edges of clique 2 are white; and the edges of clique 3 are green.
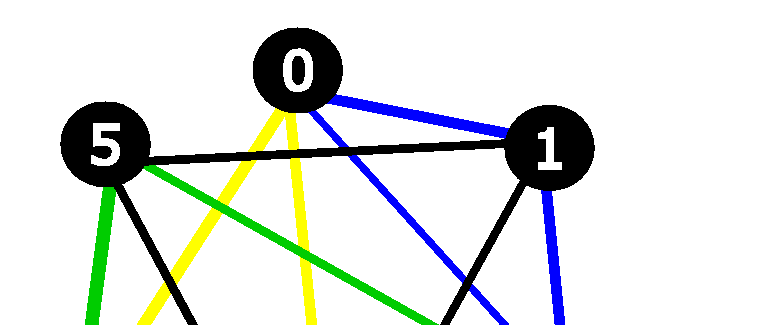
As you can see in the diagram, the largest clique is also size 3 or n - 1. Therefore, the minimum number of colors needed to color this graph is greater than or equal to 3. You can, in fact, color this graph with 3 colors, as shown in the following diagram. None of the nodes connected by an edge share a color.
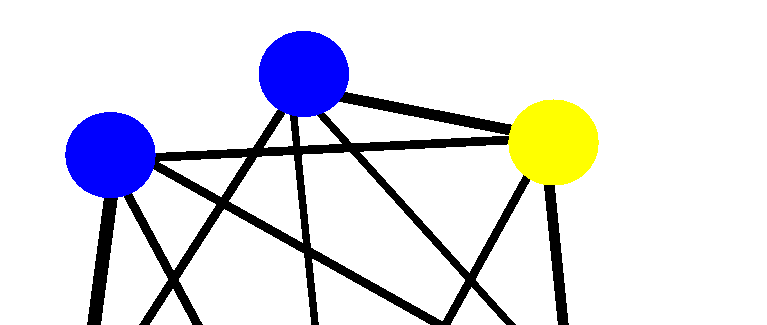
Of course, figuring out how to color a simple graph like this one is easy to do without using Solver. However, graphs representing scheduling or frequency assignment problems can have hundreds or thousands of nodes.
Step 1 - | Describe the problem |
The first step in modeling and solving a problem is to write a natural language description of the problem, identifying the decision variables and the constraints on these variables.
Write a natural language description of this problem. Answer these questions:
| © Copyright IBM Corp. 1987, 2009. Legal terms. | PREVIOUS NEXT |