Using the Constraint Profiler
 PREVIOUS
NEXT
PREVIOUS
NEXT
| IBM ILOG Solver Debugger User's Manual > Debugging and Performance Tuning for Solver-based Applications > Using the Constraint Profiler |
Using the Constraint Profiler |
INDEX
PREVIOUS
NEXT
|
You can access the current state of statistics at any moment during the search or the initial propagation by selecting the menu item View > Constraint Profiler, or by clicking on the Constraint Profiler button  in the tool bar.
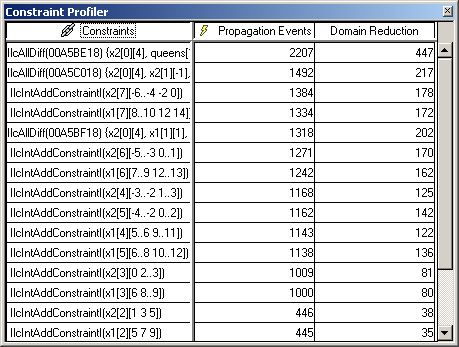
The Constraint Profiler displays statistics, by constraint, about the number of propagation events triggered and the effective domain reduction achieved when the corresponding constraint is active. You can double-click on a column title to sort the lines by:
A constraint can be called several times with no efficiency in terms of domain reduction. The column domain reduction corresponds to the sum of the values removed by the active constraint from integer variables. The domain reduction is evaluated by taking the difference of the value returned by getSize() on the variables before and after the event.
| Note |
| You can copy the content of the Constraint Profiler by selecting cells while dragging the mouse and then pressing Ctrl-C. You can paste the result in Microsoft Excel or Star Office. |
| © Copyright IBM Corp. 1987, 2009. Legal terms. | PREVIOUS NEXT |