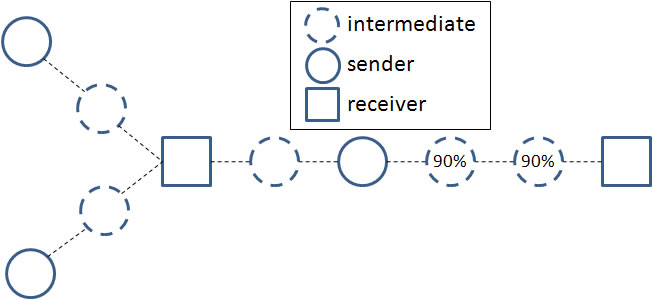
First simulated wireless scenario and relative battery level of nodes (100% when not specified)
The main purpose of our simulations (based on the ns2 simulator) is to assess the performance of the proposed RM metrics when they are exploited to reconfigure activated paths. For the sake of clarity, by concisely anticipating the experimental results detailed in the following, SP demonstrates to be insufficiently flexible, being unable to fully and fairly exploit the connectivity resources available in highly spontaneous and self-organizing environments. On the contrary, the Mixed strategy proves to be capable of achieving the best trade-off between throughput and fair exploitation of resources.
To be more specific, we have decided to adopt (and to quantitatively evaluate) the following performance indicators:
efficacy, including measurements of the achieved capabilities in terms of
• Average Gateway Throughput (Mb/s) of nodes currently serving as gateways to the traditional Internet, i.e., working as the last-hop toward the wired infrastructure;
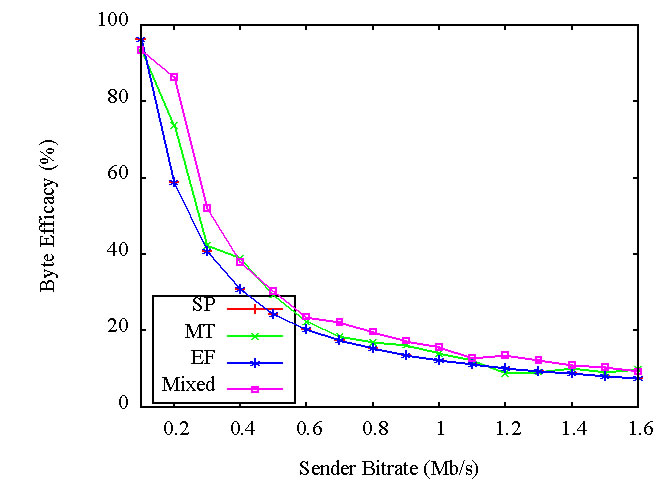
• Byte Efficacy (percentage), i.e., the ratio of the Average Gateway Throughput by the data bitrate of clients producing traffic, namely senders;
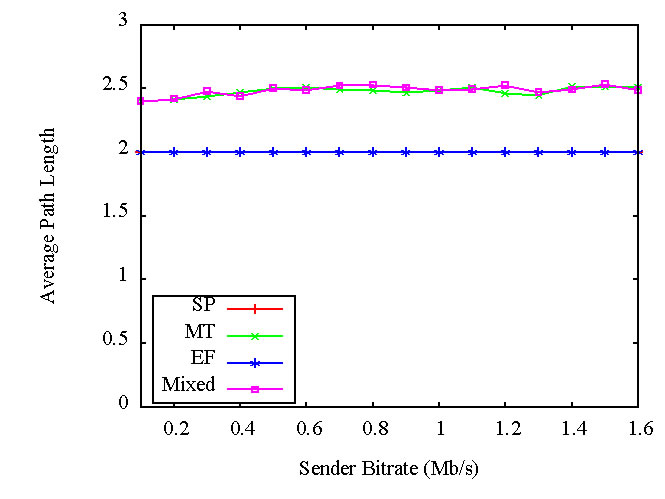
• Average Path Length, i.e., the average number of hops that packets traverse from a sender to a gateway. This parameter is relevant because it also provides an estimation of the average time needed for path traversing (linear dependence);
efficiency, comprising indicators about the amount of exploited/wasted resources, i.e.,
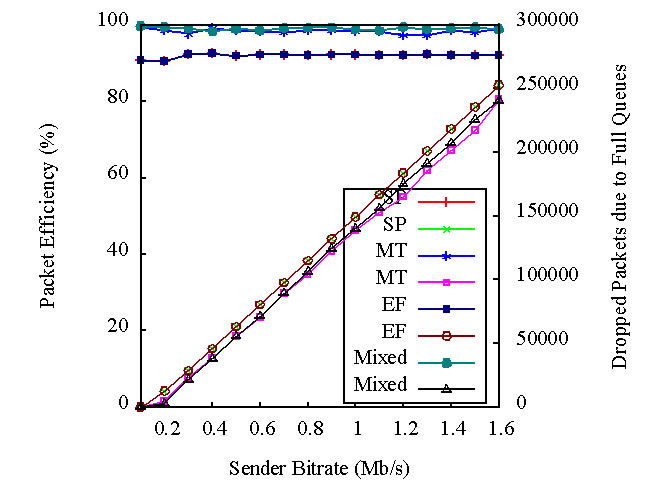
• Packet Efficiency (percentage) as the ratio between sent and received data packets by all nodes (including clients, gateways, and intermediate nodes);
• the number of Dropped Packets due to Full Queues, which provides a measurement of bandwidth saturation;
• Normalized Path Reconfigurations as the number of path modifications (i.e., routing rule modifications) for each participating node excluding gateways (they have not routing rules towards the Internet to modify depending on connectivity conditions);
fairness, including the indicators that evaluate the degree of homogeneity with which the available resources are exploited, such as
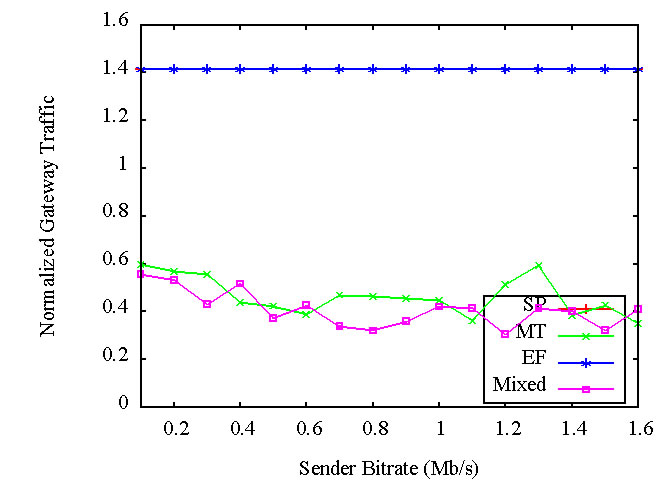
• Normalized Gateway Traffic, i.e., the ratio of the standard deviation of the Average Gateway Throughput by its value, where 0 is the optimal result (meaning that any gateway received the same amount of data);
• Normalized Energy, i.e., the ratio of the standard deviation of node energy by its average value, where 0 is the optimal result (meaning that all nodes have the same energy level at the end of the simulation period).
For the sake of clearness and simplicity we have focused on the uplink traffic generated by senders and received by gateways, e.g., by considering an FTP file upload at constant bitrate. Analogous performance results can be achieved considering downlink traffic.
Of course, different evaluation metrics tend to generate different MMHC topologies with different activated paths, by producing different client bitrates, even in the challenging condition of bandwidth saturation. For this reason, we present how performance results change depending not only on RM evaluation metrics, but also on sender bitrate.
All measured indicators are affected by the exploitation of the RTS/CTS mechanism of the IEEE 802.11 protocol. In particular, the adoption of RTS/CTS improves efficiency (reduction of packet collisions). However, by comparing the performance of the SP, MT, EF, and Mixed evaluation metrics at different sender bitrates, we have observed that the general trends for the categorized properties of efficacy, efficiency, and fairness do not change sensibly. In addition, most currently installed wireless equipment does not exploit (or even support) RTS/CTS.
The simulation time we have employed in all experiments is either 100s or 500s, thus sampling the MMHC behavior for a sufficiently long time-window after path establishment. Note that longer simulations have exhibited the same performance trends of the shorter ones.
In any simulation, each client starts sending data after 10s and keeps sending data until 10s before simulation time ends; each single-hop link has a bandwidth of 5.0Mb/s. For better readability, ET estimations will be given as percentage values.
The First Scenario consists of three senders, two gateways, and five intermediate nodes. Two intermediate nodes have a starting battery level slightly lower than the others. The two left-most senders exploit their only available gateway, despite the adopted routing strategy. Instead, the sender at the center can select to send data to anyone of the two gateways. In the case of SP, the central sender transmits data to the left-most gateway (2-hop distance instead of 3). In the case of MT, it sends data to the right gateway (ET value of 51.2% instead of 21.3%). EF forces the selection of the path on the left, since the path on the right has a lower APE (93.3% instead of 100%). Mixed behaves exactly as ET. Let us note that, even if this case models a simple environment, it is exemplar of many realistic self-organizing networks (even composed by many nodes) where collaborating entities have to select among a limited number of activated paths, mainly differing in offered throughput.
First simulated wireless scenario and relative battery level of nodes (100% when not specified)
Efficacy
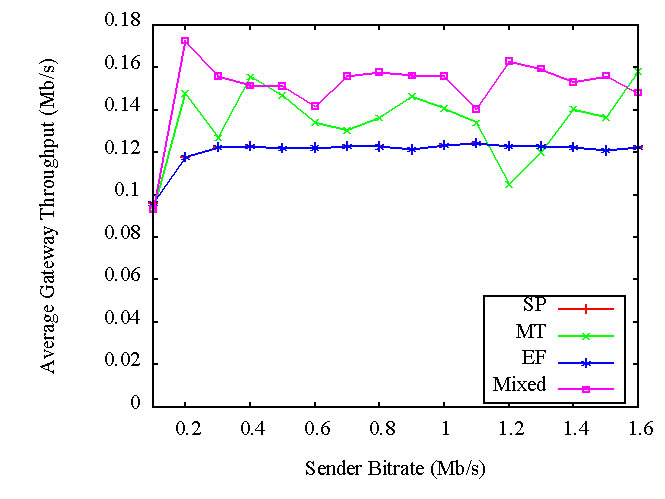
The most notable difference among the 4 strategies is that MT and Mixed perform much better than SP and EF. In fact, since in this scenario SP and EF tend to exploit only the left-most gateway, they reach bandwidth saturation before the other ones (maximum throughput of about 0.38Mb/s with 0.5Mb/s bitrate). On the contrary, because MT and Mixed exploit the right-most gateway since the beginning of the simulation, they reach bandwidth saturation at a later time (maximum throughput of about 0.62Mb/s with 0.9Mb/s bitrate). The Average Path Length is only slightly longer in the case of MT/Mixed than SP/EF. Comparing throughput and hop count performance, it is interesting to observe that MT and Mixed are able to increase throughput with limited negative effects on the increase of expected path length (and consequently on RTT).
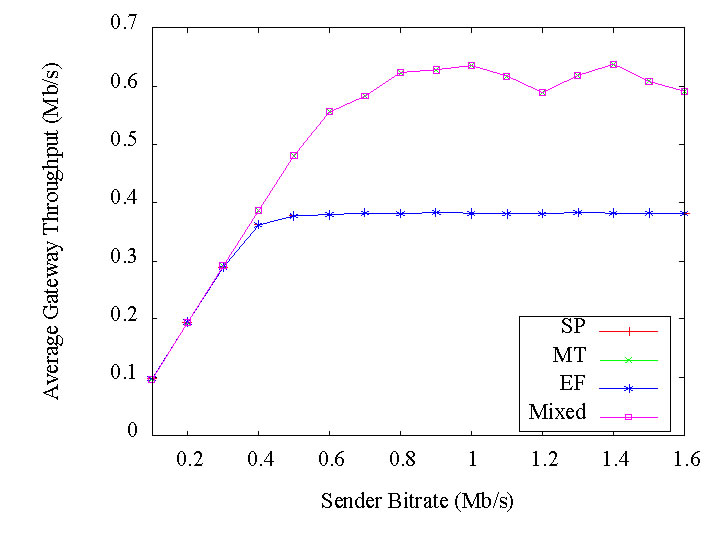
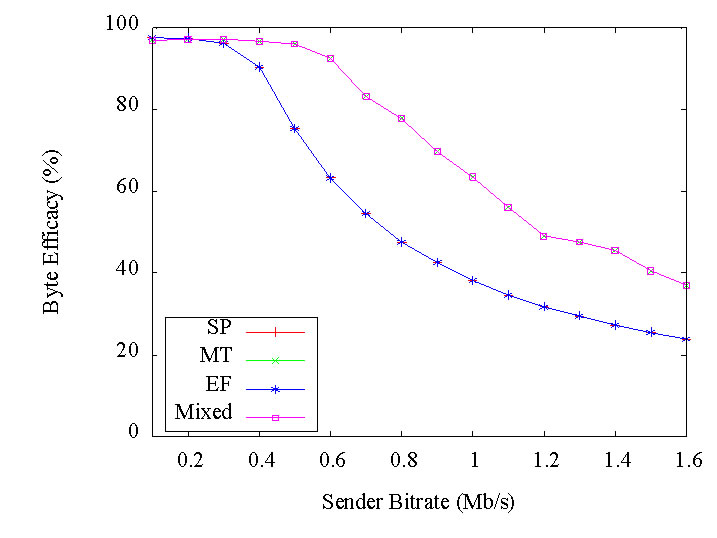
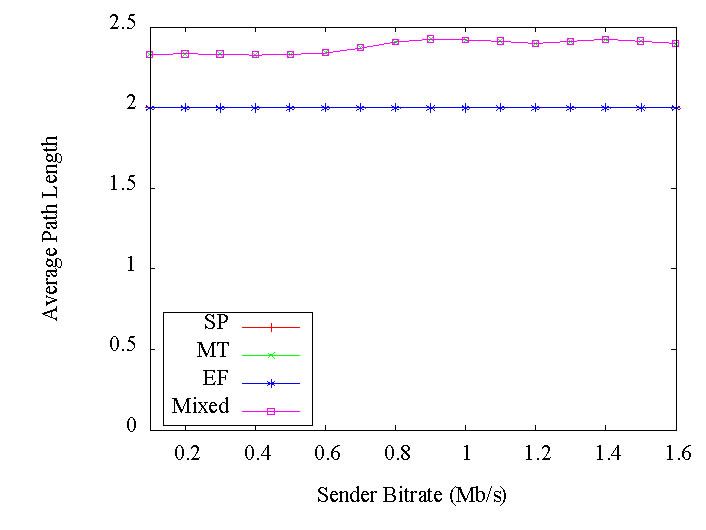
Efficacy in our first simulated scenario (simulation period 100s, without RTS/CTS mechanism) in terms of Average Gateway Throughput (left), Byte Efficacy (center), and Average Path Length (right).
Efficiency
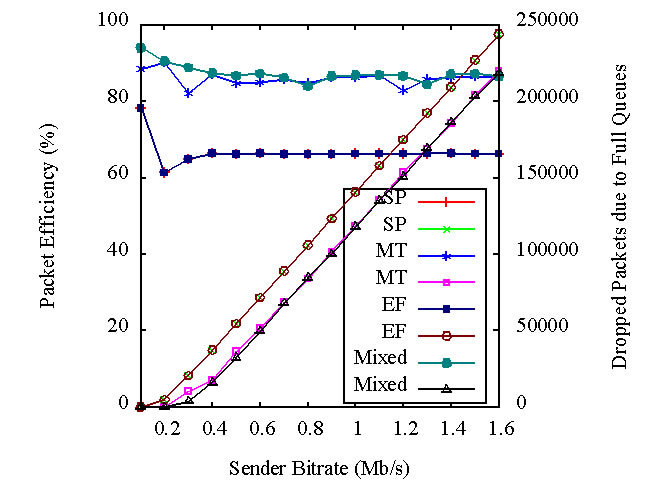
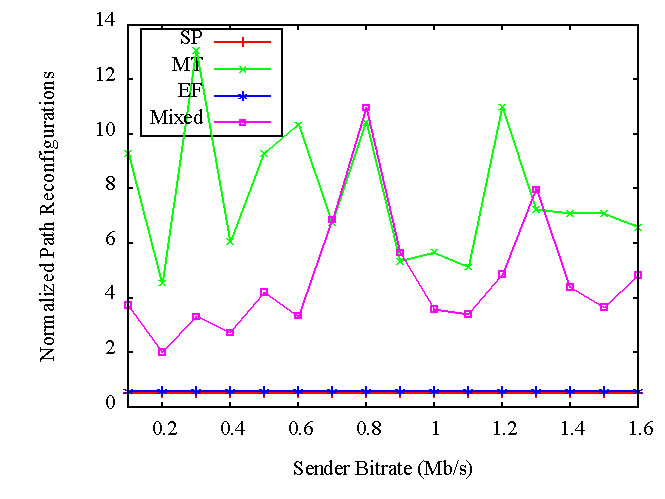
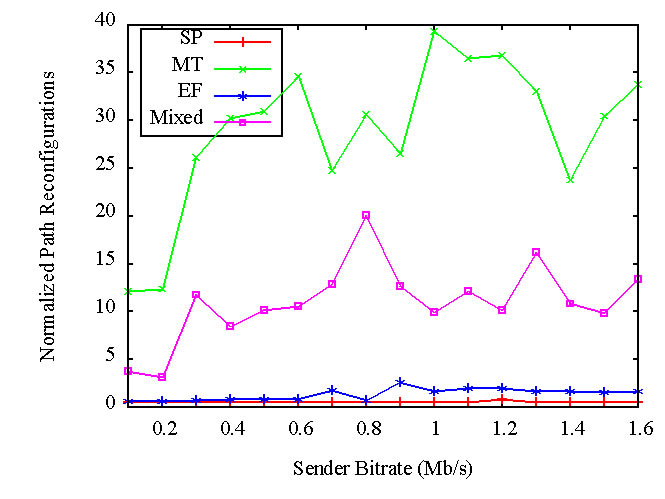
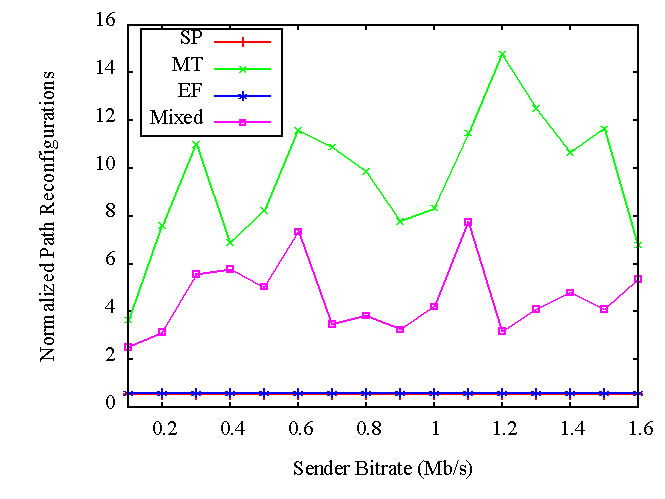
MT and Mixed demonstrate to behave better than SP and EF (Packet Efficiency is about 80%, instead of only 60%); in addition, the number of dropped packets is much higher for SP/EF. This is mainly due, again, to the fact that these strategies exploit only one gateway, making more probable both packet collisions and full queues. The number of Path Modifications is almost the same in the case of SP and EF. On the opposite, MT and Mixed tend to induce a higher number of path modifications when the bandwidth is in saturation conditions. The reason is that a node considers the current link as lost, even if still available, when it perceives multiple consecutive packet failures (as frequently occurring in bandwidth saturation conditions). As a consequence, the node selects one of the available remote nodes (here, usually, the node on the left). In the case of MT/Mixed, our RM strategy has to perform an additional path reconfiguration to the node on the right (higher number of path reconfigurations). However, the frequency of reconfiguration is rather limited even when exploiting MT/Mixed.
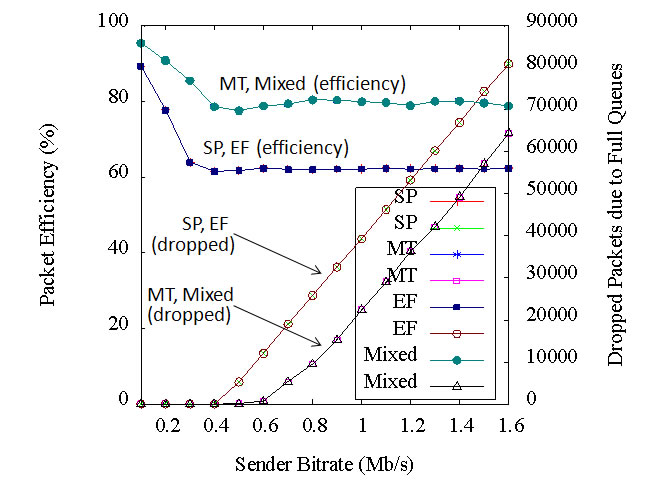
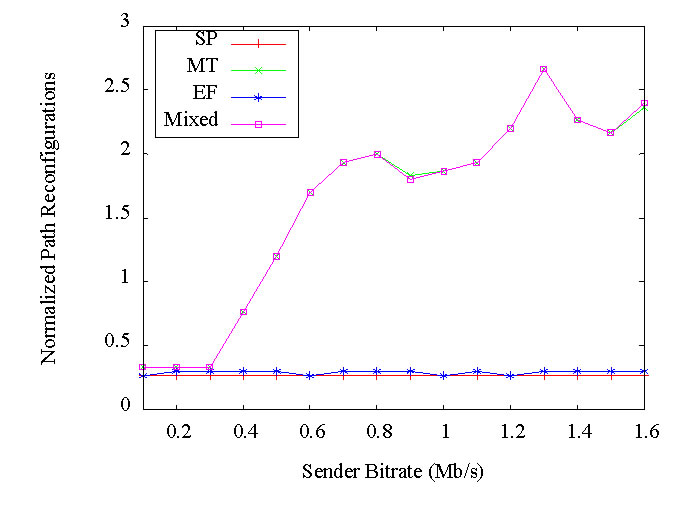
Efficiency in our first simulated scenario (simulation period 100s, without RTS/CTS mechanism) in terms of Packet Efficiency (upper graph, left y axis), Dropped Packets (upper graph, right y axis), and Normalized Path Reconfigurations (down).
Fairness
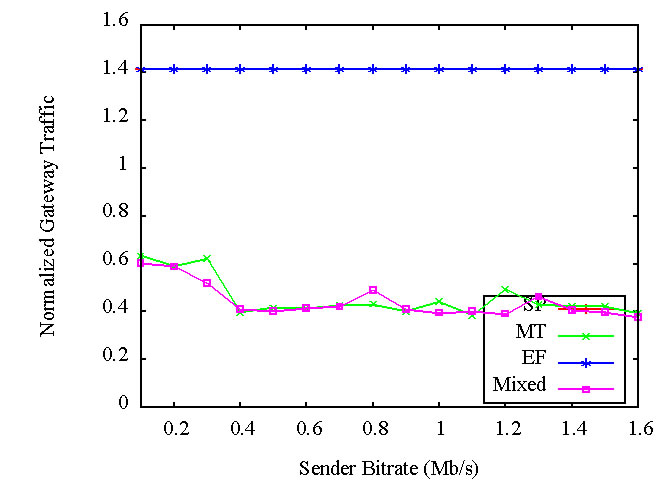
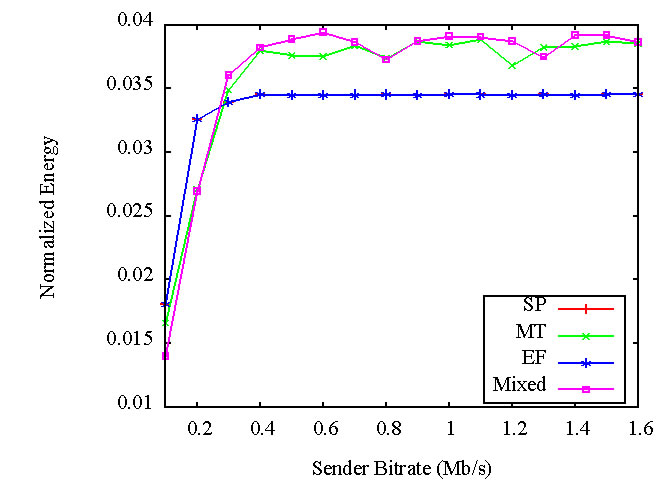
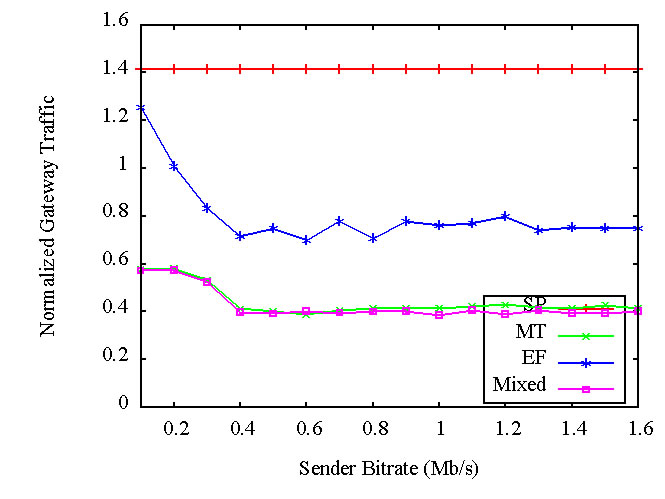
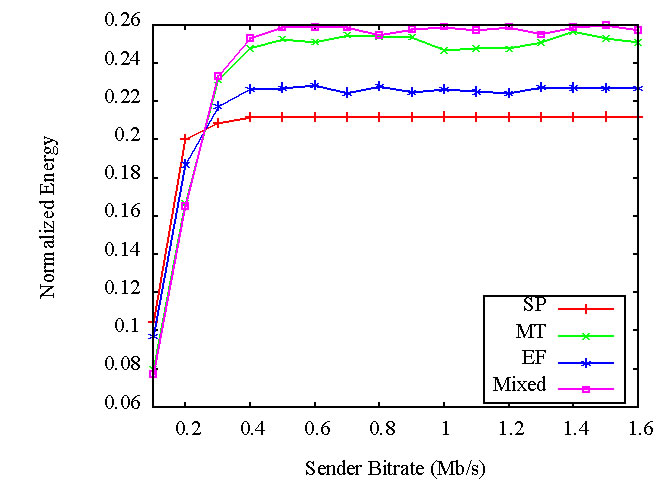
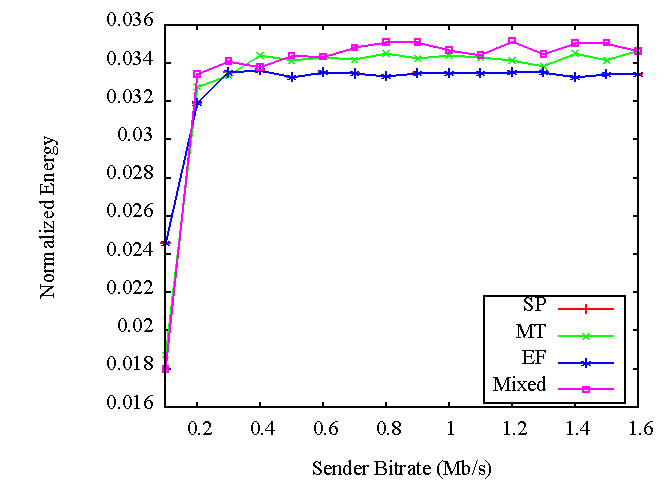
The Normalized Gateway Traffic of SP/EF keeps constant at 1 because SP and EF exploit only one of the two available gateways (clear unfairness). MT and Mixed show better fairness; however, the Normalized Gateway Traffic is higher than 0 because the left-most gateway has greater throughput than the right-most one. The Normalized Energy chart shows a similar pattern for any of the 4 strategies: Normalized Energy increases linearly with the achieved throughput. In particular, SP and EF reach a maximum at about 0.5Mb/s, while MT and Mixed at about 0.9 Mb/s, which is the lowest bitrate providing maximum throughput. At simulation start the Normalized Energy value is 0.024 because all nodes start with almost the same energy level.
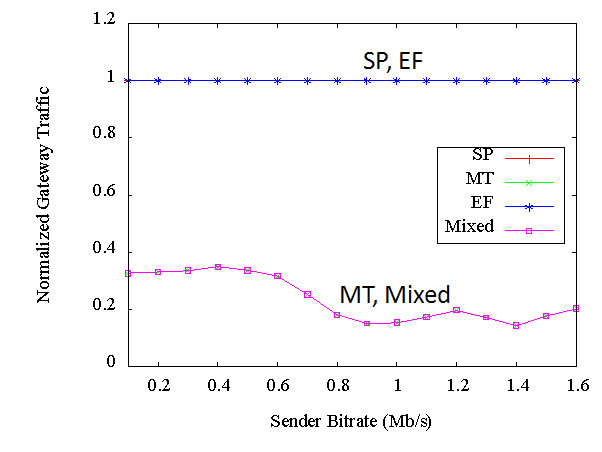
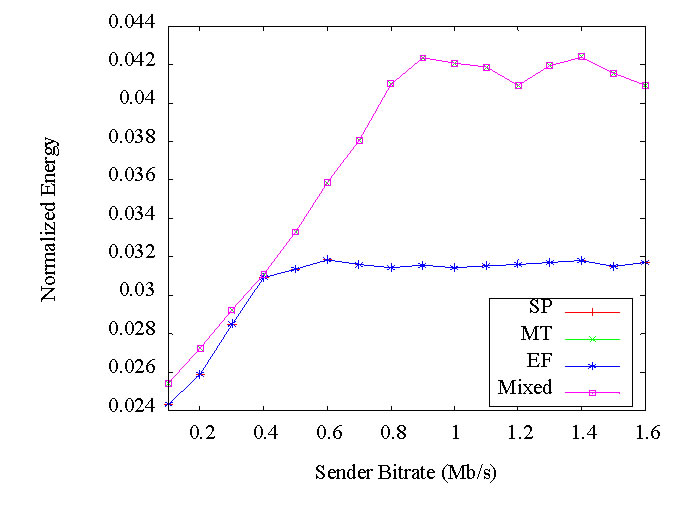
Fairness in our first simulated scenario (simulation period 100s, without RTS/CTS mechanism) in terms of Normalized Gateway Throughput (up) and Normalized Energy (down).
From the comparison of achieved throughput and energy fairness, it is interesting to note that MT and Mixed behave similarly to SP and EF until 0.4Mb/s, i.e., until the latter reach bandwidth saturation. For instance, at 0.4Mb/s any strategy achieves almost the same Normalized Energy, even if MT and Mixed with a slightly higher throughput. However, at 0.9Mb/s, MT and Mixed show a higher Normalized Energy due to higher throughput.
In conclusion, MT and Mixed can achieve higher throughput and almost the same RTT of SP and EF. Furthermore, despite the slightly longer path, MT and Mixed do not show a sensible degradation of energy fairness, at least until the achieved throughput is similar.
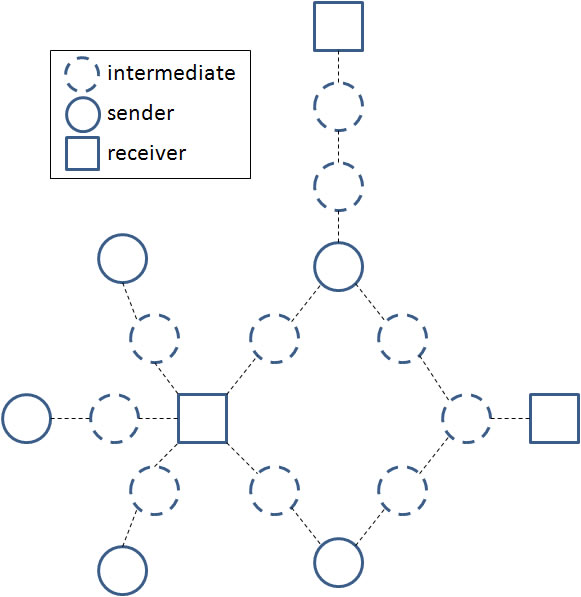
Second simulated wireless scenario
In the second simulated scenario 5 senders compete for 3 receivers in a topology where some paths provide similar performance. In particular, the bottom-right sender has to evaluate and select among the right-most and left-most receivers while the top-right sender among all the three receivers.
Adopting the SP solution both the bottom- and top-right senders always exploit the left-most receiver. The EF solution at the beginning does not provide any support in the path selection procedure, since every path has the same 100% energy. MT and Mixed solutions push the bottom-right sender to choose the right-most receiver and the top-right sender the top-right receiver.
Our main purpose is to compare achieved performance when simulating:
• not adopting vs. adopting RTS/CTS
• short vs. long periods
First of all we have simulated the scenario above with a simulation period of 100s and without exploiting the RTS/CTS mechanism.
Efficacy
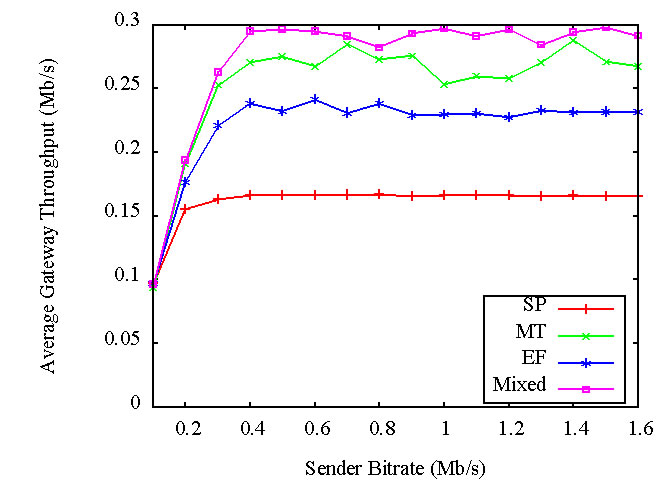
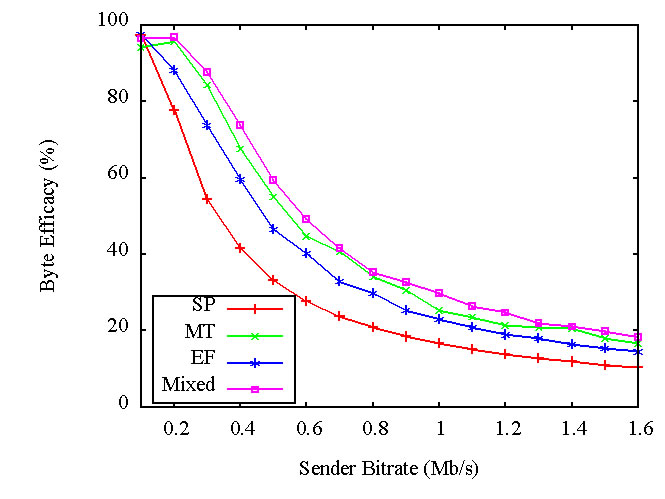
SP and EF achieve the worst throughput. In both cases all the senders exploit only one receiver, thus not fully exploiting available resources.
MT and Mixed achieve the highest throughput since they better exploit available resources. Note that MT and Mixed behave almost in the same manner: since APE values are almost the same, the ET parameter is decisive in the selection procedure.
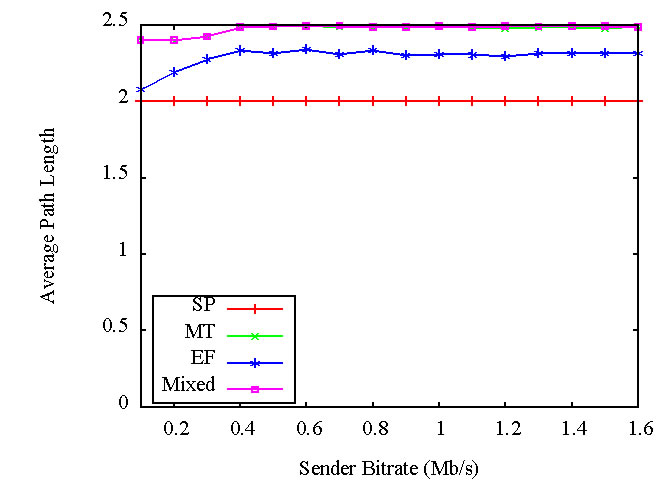
The Average Path Length is similar for every solution, with negligible differences. In fact, it increases from about 2 hops for SP and EF to about 2.5 hops for MT and Mixed. It means that MT and Mixed are able to achieve higher throughput at the cost of slightly increasing the RTT.
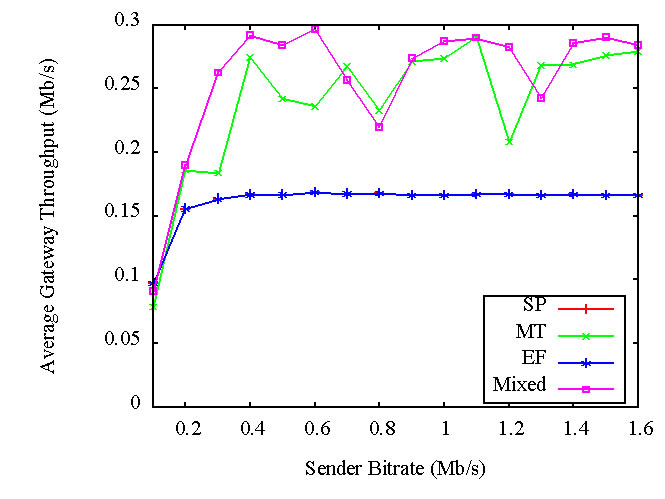
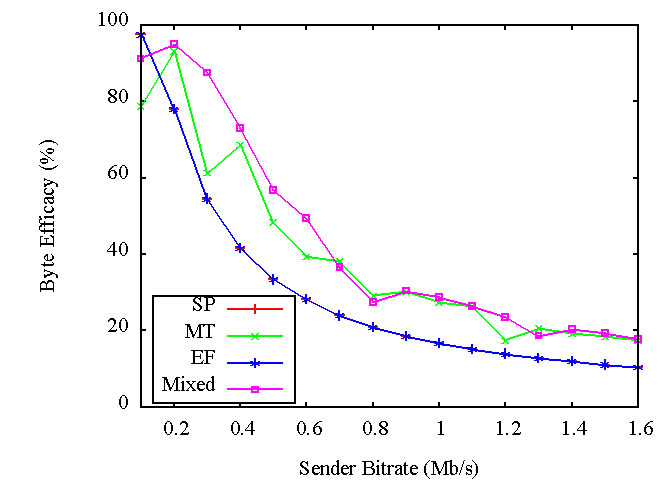
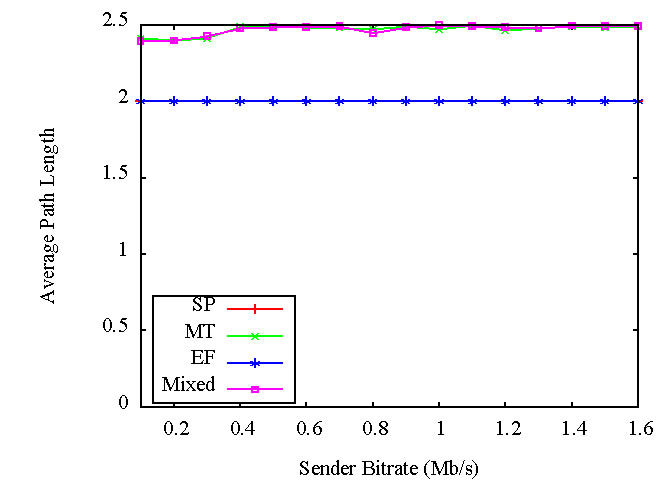
Efficacy in our second simulated scenario (simulation period 100s, without RTS/CTS mechanism) in terms of Average Gateway Throughput (left), Byte Efficacy (center), and Average Path Length (right).
Efficiency
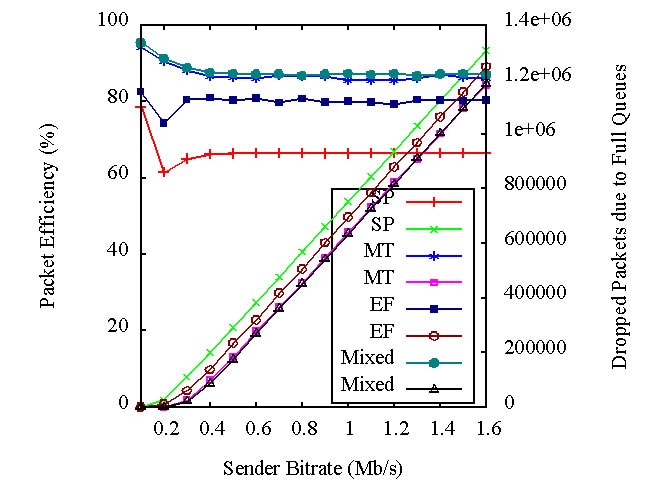
In terms of efficiency, MT and Mixed outperform the other two solutions. Adopting less loaded paths, they reduce the number of packet collisions and even the number of packets in the queues.
However, MT and Mixed show in this specific scenario a higher number of path modifications, thus potentially delving into relatively frequent short disconnections. This is due to the fact that this specific scenario provides paths with similar characteristics in terms of ET, and thus can be regarded as particularly challenging for our decision procedure. For this reason MT and Mixed may tend to trigger a higher number of reconfigurations, even if the frequency remains quite low. For instance, considering 7 path reconfigurations per node, it means that every node performs a path modification about every 14s, which is acceptable even in a spontaneous environment. Let us stress that exploiting a more aggressive hysteresis-based approach when comparing ET and APE could bring to less path modifications, at the cost of achieving sub-optimal solutions in terms of throughput and fair energy resources exploitations.
Fairness
Finally, both MT and Mixed are able to exploit resources fairer. In particular, these solutions exploit every available receiver, delving into a much better Normalized Receiver Traffic.
Furthermore, it is worth noting that MT and Mixed are able to achieve higher throughput with lower Normalized Energy. For instance, at 0.2 bitrate MT and Mixed achieve a throughput of about 0.18 and a Normalized Energy of 0.026, while SP and EF a throughput of about 0.16 and a Normalized Energy of about 0.032. At higher bitrate the much greater throughput achieved by MT and Mixed delves into only slightly higher Normalized Energy values.
These performance results confirm that MT and Mixed are able to exploit resources in a fairer manner even when available paths have similar characteristics.
Efficiency (left) in our second simulated scenario (simulation period 100s, without RTS/CTS mechanism) in terms of Packet Efficiency (upper graph, left y axis), Dropped Packets (upper graph, right y axis), and Normalized Path Reconfigurations (down).
Fairness (right) in our second simulated scenario (simulation period 100s, without RTS/CTS mechanism) in terms of Normalized Gateway Throughput (up) and Normalized Energy (down).
Secondly, we have tested the same scenario with a longer simulation period of 500s (instead of 100s). When performing longer simulations we have generally achieved the same performance trends, with the difference that battery consumption may trigger different choices when exploiting the APE parameter.
Efficacy
Even in this scenario SP achieves the worst throughput while EF a slightly higher throughput.
In the former case all the senders exploit only one receiver, thus not fully exploiting available resources.
In the latter case bottom- and top-right senders occasionally exploit even the other two receivers (triggered by the APE parameter when the battery level of the intermediated node lowers),
thus providing slightly better performance. This behavior is confirmed even by the slightly higher number of Average Path Length achieved in case of ET metric if compared with the shorter simulation period.
Efficacy in our second simulated scenario (simulation period 500s, RTS/CTS mechanism not exploited) in terms of Average Gateway Throughput (left), Byte Efficacy (center), and Average Path Length (right).
Efficiency
EF achieves even a better packet efficiency than in the longer scenario, since in this case it exploits alternative less-loaded paths, thus incurring in less packet collisions and packet drops due to full queue.
The number of path reconfigurations is higher considering both MT and Mixed. This trend is justified by the fact that longer simulation periods push for more reconfiguration; however, the frequency of reconfiguration remains almost the same.
Fairness
EF behaves in a fairer manner, since in this case it exploits more receivers.
However, since the simulation period is longer the batteries of nodes are exploited more intensively and in a less homogeneous manner, thus delving into higher Normalized Path Energy.
Efficiency (left) in our second simulated scenario (simulation period 500s, RTS/CTS mechanism not exploited) in terms of Packet Efficiency (upper graph, left y axis), Dropped Packets (upper graph, right y axis), and Normalized Path Reconfigurations (down).
Fairness (right) in our second simulated scenario (simulation period 500s, RTS/CTS mechanism not exploited) in terms of Normalized Gateway Throughput (up) and Normalized Energy (down).
Finally, we have tested all measured indicators exploiting the RTS/CTS mechanism of the IEEE 802.11 protocol. In particular, the adoption of RTS/CTS aims at improving efficiency (reduction of packet collisions), as demonstrated by achieved performance results.
Efficacy
Comparing solutions without (previous performance results) and with (below) RTS/CTS it is evident that the formers perform much better.
This is not surprising since the exploitation of RTS/CTS lowers the maximum throughput it is possible to achieve
since it imposes additional overhead. This is the main reason why most of the currently spread IEEE 802.11 interfaces does not implement the RTS/CTS mechanism.
Efficacy in our secondsimulated scenario (simulation period 100s, with RTS/CTS mechanism) in terms of Average Gateway Throughput (left), Byte Efficacy (center), and Average Path Length (right).
Efficiency
It is evident that efficiency is greatly higher when exploiting RTS/CTS. It is quite obvious since the main purpose of this mechanism is to reduce the number of packet collisions. However, the number of dropped packets due to full queues slightly increases (see scenario with 100s simulation period) since nodes do not send data packets until a RTS/CTS handshake has been accomplished, thus delaying their transmission and making more probable to make queues full.
Fairness
From a fairness point of view the adoption of the RTS/CTS mechanism does not modify performance sensibly. The only difference is the Normalized Energy is almost the same for every adopted metric, due to the fact that paths and intermediate nodes are exploited less intensively (as demonstrated by the lower throughput).
Efficiency (left) in our second simulated scenario (simulation period 100s, with RTS/CTS mechanism) in terms of Packet Efficiency (upper graph, left y axis), Dropped Packets (upper graph, right y axis), and Normalized Path Reconfigurations (down).
Fairness (right) in our second simulated scenario (simulation period 100s, with RTS/CTS mechanism) in terms of Normalized Gateway Throughput (up) and Normalized Energy (down).