This page focuses on
Mobility Prediction comparing its performance when based on either RSSI or wireless
client position information. Grey Model is exploited to forecast next RSSI and wireless client position.
Introduction
Service provisioning in the wireless Internet usually calls for downsizing
service contents to suit the specific limits of client devices. For instance,
dynamic content negotiation and tailoring are crucial for multimodal services
that are willing to provide resource-consuming multimedia in Web pages.
In addition, device mobility requires other support operations that are too
expensive to be performed by severely limited devices, e.g., context-aware
local/global resource retrieval and binding. On the one hand, local discovery
operations may consume non-negligible client resources to explore the execution
environment and to negotiate with available services. On the other hand, the
global identification and retrieval of user-related properties, such as
user/terminal profiles and security certificates stored in directories, may
require long continuous connectivity, difficult to be handled directly by
portable devices.
We claim that wireless Internet service provisioning can
significantly benefit from distributed and active infrastructures of mobile
middleware proxies working in the fixed network on behalf of portable devices.
Proxies can decide the best adaptation operations to perform on service results
and can be in charge of any additional management operation, such as supporting
connectivity and discovering the needed resources/service components, either in
the current wireless locality or in the whole Internet environment. Moreover,
proxies can act, locally to the client, as distributed cache repositories for
successive service requests. In addition, if proxies are mobile, they can follow
device movements during service provisioning by supporting session migration
between the different network localities visited, and install automatically only
where and when needed.
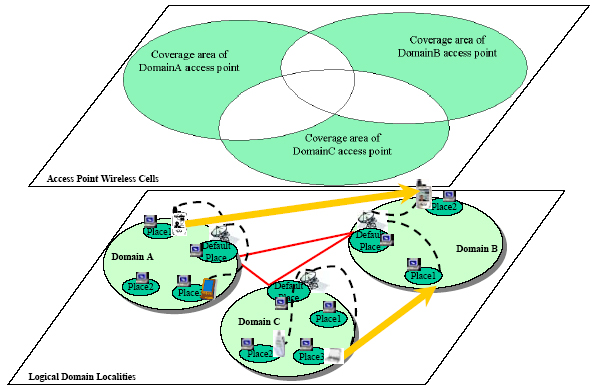
For all above reasons, the primary design choice in
SOMA-based middlewares for the wireless Internet is to provide any wireless
device with one SOMA-based companion entity, called shadow proxy, which run in
a wired node (place) in the same wireless network locality that currently
provides connectivity to the device. Wired/wireless terminals in a locality can
be grouped into logical domains, as depicted in the next figure; domains are
disjointed, even if they include wireless access points with coverage areas
that partially overlap.
Shadow proxies are in charge of determining the applicable context for their
clients and of consequently retrieving and binding to the needed local/global
resources and service components. Proxies solve the issues related to receiving,
caching, and coordinating the tailoring of service contents by taking
context-dependent decisions based on profile metadata that describe device
characteristics and user preferences.
In the following, the paper
concentrates on the crucial issue of how to predict the client movements between
SOMA localities in order to migrate in advance the proxies to the next domain
of attachment of their associated clients. A detailed description of the design
and implementation of the different SOMA middleware components that support the
distribution of context-dependent news and video on demand to wire-less devices
is out of the scope of the paper, and can be found elsewhere.
To better
understand the need for mobility prediction, let us describe the service
management operations that the SOMA-based middleware performs in response to a
client change of locality. Let us suppose a user roams from DomainA to DomainB
in the above figure while she is receiving her personalized service contents.
Depending on the (usually configurable) handover strategy of the underlying
communication layer, the user device is transparently deassociated from the
origin wireless cell and associated to the destination one i) when the client no
more receives the origin signal, ii) when the destination RSSI overcomes the
origin RSSI (handover hysteresis = 0), iii) or, more generally, when the
destination RSSI overcomes the origin RSSI of a specified threshold t (handover
hysteresis = t).
Once notified of the communication handover, the middleware
should migrate the shadow proxy to the destination domain. There, the proxy
should instantiate and con-figure the needed local middleware components and
reconnect to the server (or to an equivalent local replica of it) before being
capable of serving its client again. This can cause a temporary suspension of
the service typically experienced by the client as a provisioning block or
delay. The goal of mobility prediction is to effectively per-form the migration
of a shadow proxy clone before the client communication handover, so to establish
the cloned proxy in the new destination domain, ready for the service session of
its incoming client.
We propose and compare three alternative solutions for mobility prediction:
RSSI-GM (Received Signal Strength Indication-Grey Model), ECP-GM (Ekahau Cell
Probability-Grey Model), and ED-GM (Ekahau Distance-Grey Model). The proposed
solutions do not need any additional
specific hardware; in particular, they do not require external GPSs, which are
still rather expensive, battery-consuming, and therefore unsuitable for very
resource-constrained wireless devices. Moreover, the mobility prediction solutions,
which we have evaluated and implemented for IEEE 802.11 connectivity, are easily
applicable also to wireless clients that exploit other forms of access point
connectivity, e.g., Bluetooth clients towards Bluetooth infotainment points.
The only constraint is to have client-side awareness of RSSI, either directly
exploited in RSSI-GM or indirectly used (via the EPE mediation) in both ECP-GM
and ED-GM.
RSSI-GM
The RSSI-GM prediction solution requires having a lightweight client stub running
on any participating client device. It is the client stub that autonomously
predicts the next cell that will be visited by the hosting wireless device and
that communicates the prediction to the shadow proxy place, thus triggering the
clone migration. To this purpose, the client stub needs to access the monitoring
data about the RSSI values of the IEEE 802.11 base stations in its visibility.
The RSSI data is used as input for a simple Grey-based discrete model GM(1,1)
for the prediction of future RSSI values. Client stubs achieve platform-
and vendor-independent visibility of RSSI data by integrating with portable and
dynamically installable monitoring mechanisms.
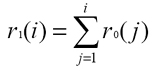
Given one reachable access point and the set of its actual RSSI values measured
at the client side
R0 = {r0(1), �, r0(n)}, where
r0(i) is the RSSI value at the
discrete time
i, it is possible to calculate
R1 = {r1(1), �, r1(n)}, where:
Then, from the GM(1,1) discrete differential equation of the first order:
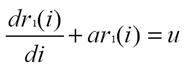
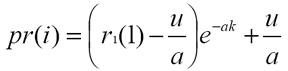
the client stub determines
a and
u, which are exploited to obtain the predicted
RSSI value
pr(i) at discrete time
i according to the GM(1,1) prediction function:
When the
pr(i) for a base station x overcomes the
pr(i) for the currently
associated base station y, then the client stub communicates the mobility
prediction to the shadow proxy place, thus triggering the proxy clone migration.
The above solution for client mobility prediction is completely local and
lightweight; any client stub can estimate its future RSSI values simply by
maintaining a finite series of previous RSSI data. In particular, the client
stub catches the needed monitoring in-formation and predicts the next cell in a
completely autonomous way, with a very limited overhead. The client stub exploits
the limited bandwidth wireless channel only occasionally to inform the shadow
proxy place in the case of predicted change of logical domain.
ECP-GM and ED-GM
Similarly to RSSI-GM, both ECP-GM and ED-GM prediction solutions use GM(1,1)
discrete models. However, they do not exploit RSSI data as the input values for
the prediction models but, respectively, the estimated probability that a client
device is located in a cell and the estimated device distances from the borders
of IEEE 802.11 cells of access points in visibility. In these two solutions, it
is directly the SOMA place hosting the shadow proxy execution that performs
mobility prediction by communicating with EPE (Ekahau Positioning Engine) to
obtain the needed information about cell probabilities and distances.
EPE is the most widespread commercial solution for non-GPS-based positioning in
IEEE 802.11 infrastructure-mode networks. For any target device, EPE
provides the probabilities that the device is located in a set of pre-defined
logical areas, i.e., configurable disjointed portions of the wireless deployment
scenario. Bayes-based probability estimation is performed by observing the
current and recent RSSI values at the target device, by comparing them with a
database of RSSI samples for the provisioning environment, and by considering a
set of specified admitted mobility paths in that environment. This implies
that, before exploiting EPE in a specific deployment scenario, system administrators
must provide EPE with a map of the environment
and the admitted paths of client movements. In addition, an initial
"learning" phase is necessary for EPE to acquire the database of RSSI samples
for the different points of the provisioning environment. The EPE system consists
of a centralized server responsible for the whole processing to obtain the
position estimations, and of lightweight Ekahau clients that run on target
wireless devices and regularly send the observed RSSI values to the EPE server.
Given a target device, ECP-GM considers the finite set of probabilities provided
by EPE and greater than a specified threshold, and applies GM(1,1) to these
probabilities. The proxy clone migration is triggered when the predicted
probability of the current shadow proxy cell becomes minor than the predicted
probability of another logical area. ED-GM, instead, exploits the position
estimation provided by EPE to calculate the distances between the target device
and the cell borders of visible base stations, and applies GM(1,1) to these
distances. In this case, the proxy clone migration is triggered when the
predicted distance from the borders of the current cell exceeds the predicted
distance from the borders of another logical area.
Let us note that, differently from RSSI-GM, both ECP-GM and ED-GM are not
completely decentralized prediction solutions. It is the Ekahau client running
on the target device that achieves visibility of the RSSI data and regularly
communicates it to EPE. In addition, the shadow proxy in charge of mobility
prediction has to interwork with the centralized EPE, which feeds the proxy with
estimations about either current cell probabilities or current distances from the
cell borders of visible base stations. In addition, since the Ekahau client is
currently available only for MS Windows, ECP-GM and ED-GM are not portable on
different operating systems, differently from the RSSI-GM solution.
To evaluate the effectiveness and performance of the proposed prediction solutions,
we have developed three alternative implementations of the mobility prediction
module: all the solutions are integrated with the SOMA platform and present the
same API. SOMA is a Java-based mobile agent system intended to support service
provisioning in pervasive and ubiquitous environments. We have extended
SOMA with the mobility prediction module by adding a shadow proxy which is a new
MA subclass that exploits the usual one. The SOMA platform (by either the client
stub in RSSI-GM or the SOMA place in ECP-GM and ED-GM) automatically notifies the
shadow proxy in the case of handover prediction for the associated client devices.
The prediction notification triggers the transparent cloning of the shadow proxy
and the clone migration to the predicted cell. The original proxy executes at its
previous place until the associated device eventually exits its wireless access
locality and completes its handover. Application developers can concentrate only
on the service-specific application logic that implements this part of shadow
proxy while SOMA automatically handles cloning, anticipated migration, and
lifecycle management of shadow proxy instances.
We have measured some performance indicators for all three mobility prediction
solutions in both a simulated environment and a real deployment scenario
involving the wireless access points in our campus. The simulation has the goal
to evaluate the solution behavior also in presence of a large number of mobile
clients roaming among a large number of wireless localities. Indicators are:
| effectiveness E1% |
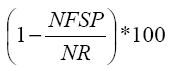 |
where NFSP measures times the wireless devices do not find their shadow proxies
already running at their destination domains at their arrivals, while NR is the
total number of client handovers; |
| efficiency E2% |
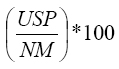 |
where USP is the number of shadow proxies eventually used by the wireless
clients and NM is the total number of migrated proxies; |
| advance time AT |
the time interval between the shadow proxy arrival at
the destination domain and the eventual client reconnection to that domain. |
Effectiveness and efficiency are both significant performance indicators. In
general, high effectiveness may be tied to low efficiency that may occur. When
the middleware exaggerates in migrating shadow proxy clones to visible
localities, by generating useless network traffic. Let us stress that migrated
proxy clones are automatically discarded if the associated clients do not reach
their domains within a timeout.
Simulations
We have developed a simple lightweight simulator to analyze wireless device
movement and to monitor RSSI. Already existing but more complex simulators can't
supply so easily and efficiently these feature. We have simulated two extreme
trajectories: trajectory1, a straight path with constant random velocity between
two random points, and trajectory2, with random variable velocity and with random
direction with a Gaussian component of 30 degree standard deviation. In both
trajectories the velocity is always between 0.2 and 2.5 m/s to mimic the behavior
of walking mobile users. Typically, wireless device performs a cell roaming when
the destination cell RSSI rises above actual cell RSSI of a fixed hysteresis
threshold. In our simulated environment the hysteresis threshold value ranges
from 0 to 2 db. On the average, each mobile client has the contemporaneous
visibility of 6 access points, that represents a worst case scenario significantly
more complex than the actually deployed wireless networks (where usually no more
than 3 access points are visible from any point).
We have tested our proposed prediction solutions in several simulated scenarios,
different in number and uniformity of deployed access points. For each scenario
we present dimensions, number and density of deployed access point, RSSI
distribution (when available), performances with trajecory1 and trajectory2
within 600 simulations for each simulated environment.
When in a particular
simulated environment handovers are rarely predicted, that is when E1% is really
low, AT is not shown because it doesn't present a significant positive value,
due to poor performances.
Environment1: uniform AP density
This is the most uniform tested environment. As you can see in figure 2,
APs are deployed in a regular squared way. Figure shows RSSI
distribution displayed from Ekahau Manager based on the collected RSSI database.
AP are where RSSI is stronger.
| Dimensions |
64m X 64m |
| Number of access points |
16 |
| Access point density |
256mq / ap |
Table 1: environment1's characteristics.

Figure 1: RSSI in db.
|
|
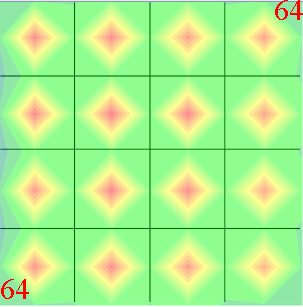
Figure 2: environment1's AP deployment.
|
| Trajectory1 |
E1% | E1% | E1% |
E2% | E2% | E2% |
AT (s) | AT (s) | AT (s) |
| Threshold (db) |
0 | 1 | 2 |
0 | 1 | 2 |
0 | 1 | 2 |
| RSSI-GM |
79.01 | 91.69 | 94.67 |
80.53 | 74.27 | 74.19 |
2.99 | 4.34 | 5.30 |
| ECP-GM |
9.67 | 14.89 | 19.61 |
30.07 | 33.24 | 37.32 |
--- | --- | --- |
| ED-GM |
21.93 | 34.99 | 43.01 |
40.63 | 43.79 | 47.21 |
--- | 0.79 | 2.56 |
Table 2: RSSI-GM, ECP-GM, and ED-GM performance results in the case of environment1 and trajectory1.
| Trajectory2 |
E1% | E1% | E1% |
E2% | E2% | E2% |
AT (s) | AT (s) | AT (s) |
| Threshold (db) |
0 | 1 | 2 |
0 | 1 | 2 |
0 | 1 | 2 |
| RSSI-GM |
75.35 | 91.00 | 93.01 |
78.61 | 76.31 | 72.86 |
2.88 | 4.12 | 4.80 |
| ECP-GM |
10.37 | 13.50 | 20.18 |
34.10 | 34.62 | 38.97 |
--- | --- | --- |
| ED-GM |
22.22 | 33.00 | 37.94 |
40.34 | 44.15 | 43.78 |
--- | 0.84 | 1.91 |
Table 3: RSSI-GM, ECP-GM, and ED-GM performance results in the case of environment1 and trajectory2.
RSSI-GM outperforms the other solutions for all three performance indicators.
EPE performs positioning quite well, but it is less prompt in ascertaining device
wireless movements that affects negatively ECP-GM and ED-GM performances. When
the hysteresis threshold increases, roaming is delayed and there is more time
to predict wireless device roaming: consequently both E1% and AT increase. In
this case, RSSI-GM E2% lowers because delayed roaming triggers more predictions,
most of them unnecessary.
In summary, RSSI-GM E1% is significant also with a null hysteresis threshold and
an higher threshold doesn't make E1% much better. As consequence E2% decreases
since NM increases and USP is almost constant. On the contrary ECP-GM and ECP-GM E2%
often rises, in particular when E1% increases, because the number of useful
predictions increases significantly, proportionally more than total number of
predictions. In fact, NM increases but USP increases furtherly.
As expected, the Gaussian Trajectory2 component makes handover prediction more
difficult; however, the performance figures exhibit only a slight occasional
deterioration.
The next goal is to prove generality of results testing our proposed system in
a non-uniform wireless environment.
Environment2: non-uniform AP density
Figure 3 shows a non-uniform AP deployment. AP density is a
bit bigger than Environment1's one.
| Dimensions |
70m X 50m |
| Number of access points |
13 |
| Access point density |
269.23mq / ap |
Table 4: environment2's characteristics.
|
|
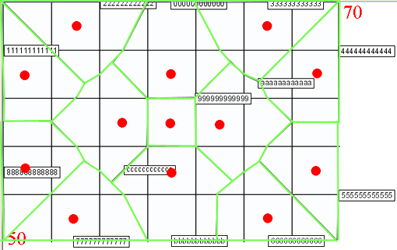
Figure 3: environment2's AP deployment (red points represent APs and green lines are cell borders).
|
| Trajectory1 |
E1% | E1% | E1% |
E2% | E2% | E2% |
AT (s) | AT (s) | AT (s) |
| Threshold (db) |
0 | 1 | 2 |
0 | 1 | 2 |
0 | 1 | 2 |
| RSSI-GM |
73.99 | 88.59 | 92.09 |
72.37 | 70.87 | 74.43 |
2.90 | 4.72 | 4.10 |
| ECP-GM |
13.00 | 20.11 | 17.51 |
27.62 | 33.33 | 24.80 |
--- | --- | --- |
| ED-GM |
17.94 | 36.41 | 41.24 |
22.35 | 32.06 | 33.80 |
--- | 1.73 | 2.43 |
Table 5: RSSI-GM, ECP-GM, and ED-GM performance results in the case of environment2 and trajectory1.
| Trajectory2 |
E1% | E1% | E1% |
E2% | E2% | E2% |
AT (s) | AT (s) | AT (s) |
| Threshold (db) |
0 | 1 | 2 |
0 | 1 | 2 |
0 | 1 | 2 |
| RSSI-GM |
75.13 | 90.34 | 94.18 |
75.32 | 71.46 | 71.73 |
2.55 | 3.64 | 4.92 |
| ECP-GM |
11.79 | 15.34 | 19.94 |
31.29 | 31.95 | 37.89 |
--- | --- | --- |
| ED-GM |
22.56 | 32.96 | 43.21 |
32.84 | 37.66 | 41.49 |
0.40 | 0.70 | 1.96 |
Table 6: RSSI-GM, ECP-GM, and ED-GM performance results in the case of environment2 and trajectory2.
Performances indicators don't change significantly from Environment1 to
Environment2; performance indicators are almost the same in a uniform
environment and in a non-uniform one.
Environment3: highly heterogeneous AP density
The last one tested environment has highly heterogeneous AP density. AP deployment
doesn't follow any rule. Note AP density is almost the same than in Environment1.
| Dimensions |
68m X 49m |
| Number of access points |
13 |
| Access point density |
256.3mq / ap |
Table 7: environment3's characteristics.
|
|
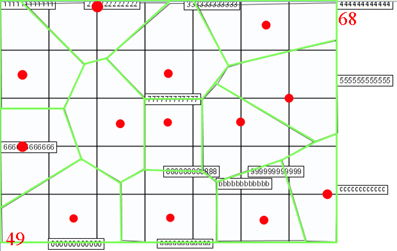
Figure 4: environment3's AP deployment (red points represent APs and green lines are cell borders).
|
| Trajectory1 |
E1% | E1% | E1% |
E2% | E2% | E2% |
AT (s) | AT (s) | AT (s) |
| Threshold (db) |
0 | 1 | 2 |
0 | 1 | 2 |
0 | 1 | 2 |
| RSSI-GM |
79.40 | 87.50 | 90.42 |
77.83 | 75.23 | 70.83 |
4.18 | 4.13 | 6.33 |
| ECP-GM |
23.11 | 25.54 | 31.38 |
42.59 | 35.07 | 40.97 |
--- | --- | 1.50 |
| ED-GM |
37.69 | 52.17 | 56.38 |
35.71 | 39.83 | 40.46 |
2.83 | 4.17 | 6.06 |
Table 8: RSSI-GM, ECP-GM, and ED-GM performance results in the case of environment3 and trajectory1.
| Trajectory2 |
E1% | E1% | E1% |
E2% | E2% | E2% |
AT (s) | AT (s) | AT (s) |
| Threshold (db) |
0 | 1 | 2 |
0 | 1 | 2 |
0 | 1 | 2 |
| RSSI-GM |
77.63 | 84.97 | 91.02 |
77.02 | 72.33 | 67.41 |
3.43 | 3.78 | 4.40 |
| ECP-GM |
22.63 | 21.31 | 23.35 |
48.04 | 43.58 | 38.42 |
0.13 | 0.35 | 0.40 |
| ED-GM |
35.79 | 38.80 | 48.80 |
41.34 | 43.69 | 45.03 |
2.10 | 2.47 | 3.62 |
Table 9: RSSI-GM, ECP-GM, and ED-GM performance results in the case of environment3 and trajectory2.
RSSI-GM always outperforms other mobility prediction solutions independently from a
particular environment. Moreover performance indicators don't change substantially
in proposed environments. Notwithstanding AP deployment in Environment1 is
completely uniform, its performance indicator values have a general validity.
In-the-Field Experiments
Apart from simulation, we have tested the three different mobility prediction
modules over an actual deployment scenarios with 5 partially overlapping IEEE
802.11b wireless cells and 10 client devices (Compaq iPAQ h3850 with Windows
CE.NET) randomly roaming in the campus environment. The deployed CISCO Aironet
1100 access points use a null signal strength hysteresis threshold for cell
handover triggering. We have imposed other hysteresis thresholds,
bigger than in simulated environments according to bigger RSSI fluctuations.
Instead of in simulations where we calculate AP RSSI, now we have to obtain from
the wireless card visible AP list with related RSSI. It's not easy to obtain
information, as actual AP or visible APs, from wireless cards because of hardware
and software heterogeneity. Windows NDIS user-level interface (ndisuio) doesn't
appear to be useful due to incompatibility from different Windows versions.
Moreover not every wireless card is 100% NDIS-compatible. So it is necessary to
implement a different low-level driver for each used wireless card. To avoid
those problems Ekahau Client (EC) presents a generic driver for NDIS-compatible
cards and also different drivers for each most common wireless card that
correctly implements AP'scan but isn't completely NDIS-compatible.
EPE obtains AP list form ECs with the following protocol:
- EPE periodically looks for active EC in the subnet sending a broadcast
"Are you there?" message;
- ECs answer with a "I'm hire" message;
- when EPE is interest in monitoring a particular EC, it sends a "Send me RSSI" message;
- now EC starts to send RSSI information packets (RIP) to EPE repeatedly.
In order to easily obtain visible AP list, we simulate EPE behavior to
stimulate ECs to send us RIP. Then we extract from RIP the visible AP list with
related RSSI and we save it. Finally as in simulations we create a Grey Model
with the most recent saved data to predict RSSI.
| Random path |
E1% | E1% | E1% |
E2% | E2% | E2% |
AT (s) | AT (s) | AT (s) |
| Threshold (db) |
3 | 6 | 9 |
3 | 6 | 9 |
3 | 6 | 9 |
| RSSI-GM |
75.00 | 91.67 | 100.0 |
100.0 | 100.0 | 100.0 |
7.65 | 9.98 | 19.24 |
| ECP-GM |
37.50 | 50.00 | 87.50 |
75.00 | 100.0 | 100.0 |
--- | 4.39 | 12.12 |
| ED-GM |
50.00 | 58.30 | 100.0 |
100.0 | 100.0 | 100.0 |
1.01 | 6.83 | 14.36 |
Table 10: RSSI-GM, ECP-GM, and ED-GM performance results in the case of in-the-field experiments.
Hysteresis threshold ranges from 3 to 9 db according to signal strength standard
deviation of about 6 db. A null hysteresis threshold induces too many unnecessary
reassociations when mobile node is between two AP. On the other hand a too high
hysteresis threshold delays too much reassociations. At our knowledge 6 db
hysteresis threshold is a good compromise.
With strong signal strength fluctuations RSSI predicted values cross early and
so mobility prediction happens early. As consequence E1% end AT of in-the-field
experiments are really good. Moreover E2% is quite perfect because mobile nodes
always associate in every AP and so there aren't useless predictions.
The experimental results outperform the simulation-based ones, showing that the
simulated environment represents a worst case scenario. RSSI-GM shows better
performances despite strong signal strength fluctuations observed in a real
environment because access points aren't as close as in simulations. For the
same reasons also ECP-GM and ED-GM show better performances than in simulation,
even if still lower than RSSI-GM ones.
In summary, the RSSI-GM mobility prediction solution has proven to offer the
best performance, both in the simulated environment and the actual deployment,
at least when the goal is handover prediction and not fine-grained positioning
prediction. In particular, RSSI-GM achieves AT values that permit SOMA to move
and reorganize the middleware support in the next visited locality for a wide
set of Internet services. In addition, if compared with ECP-GM and ED-GM,
RSSI-GM has also significant advantages in terms of simplicity since it doesn't
need additional components as EPE.