Protocol Accuracy

Topics

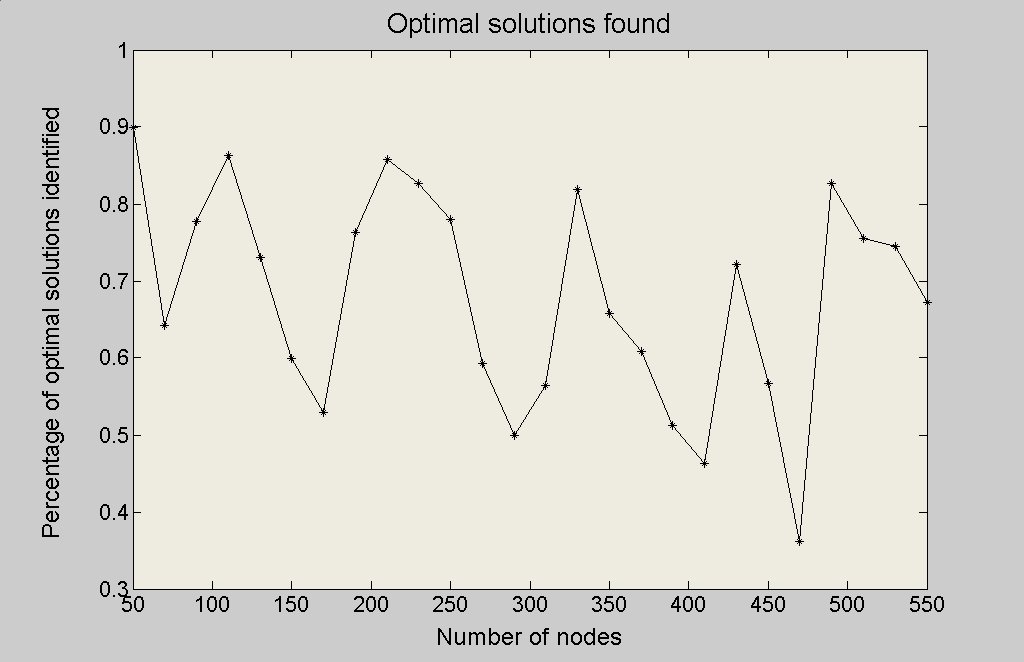
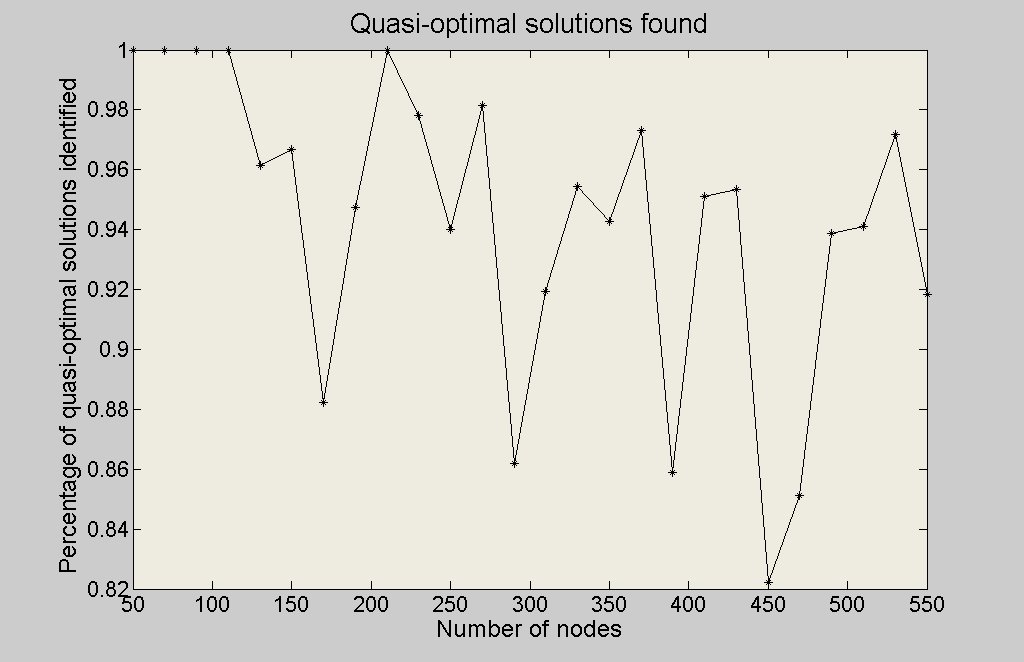
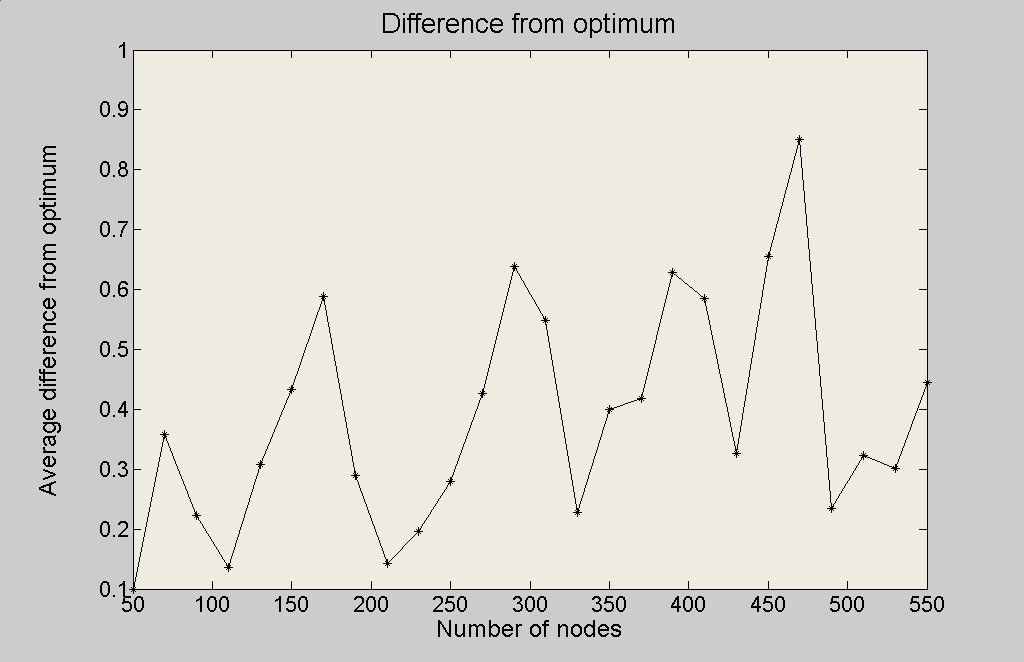
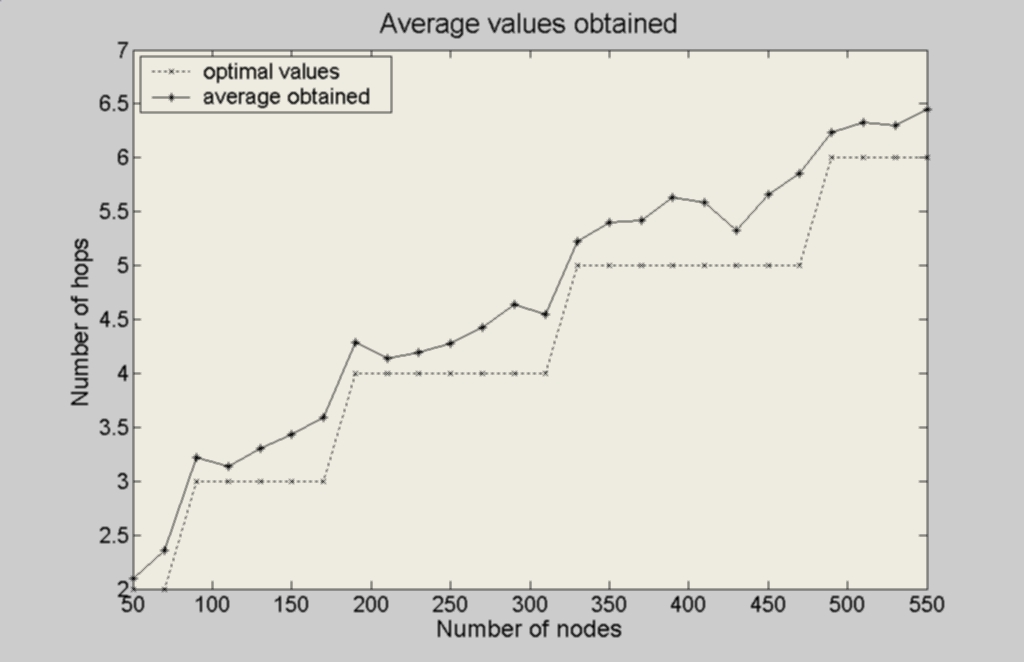
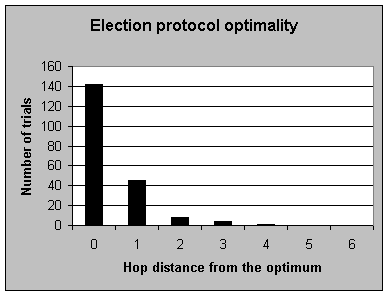
By keeping unchanged the parameters reported in Manager Election Results , we tested also the optimality of the Manager Election Protocol. We measured the difference between the optimum solution and the one eventually obtained using the proposed protocol over 200 experiments. In other words, we found which was the optimum solution for the 550 nodes scenario and measured its value (6 hops from the farthest nodes). Then, we ran our algorithm 200 times, starting each election from a different node. The figure depicts the results we obtained.


We obtained a number of other protocol accuracy results by experimenting the Manager Election over the same set of scenarios previously considered.
   
Next figure reports the percentage of optimal results obtained in the different scenarios. As we can see, the results range between 0.4 and 0.9.
The following rule intuitively explains the serrate trend of the reported traces. Consider that the dense MANET diameter (approximately the diagonal of the IS square) used for the different scenarios grows slowly (each step increases the diameter of less than a hop).
Rule of thumb : When the diameter increases from 2x to (2x+ß), with ß(>0) small at will, the number of optimal nodes suddently grows since the optimal value increases from x to (x+1).
Thus, the number of optimal solutions suddently icreases in these transition areas. This consideration is supported by the following graphs (in particular by Average values obtained).


As we explained in the general description, REDMAN does not address optimal results, but promotes protocol lightweightness by accepting only quasi-optimal results. The next graph clearly supports these guideline. Accuracy results drastically improve when we consider the percentage of trials identifying optimal or quasi-optimal (i.e., 1 hop from optimal) solutions.
Results range between 82% and 100% of quasi-optimal solutions found.


To better understand the protocol behavior, apart from optimal and quasi-optimal experiments, we measured also average optimality results. Next figure plots the average difference (in terms of number of hops) between the values of obtained solutions and of the optimal one in each scenario. For the considered set of scenarios we found solutions within one hop from the optimum on average.


Finally, the next figure combines the previous result with the optimal values obtainable in the proposed scenarios. This can better show our protocol's accuracy level.
Let us point out that the accuracy is roughly dependent on the percentage of optimal nodes present in the dense MANET. Thus, as we expected (rule of thumb),


All these experiments have been obtained by employing the second version of the Manager Election Protocol implementation, since routing algorithms over NS-2 showed instable behaviors.