Dense MANET Identification Protocol Simulation
|
|
We tested the Dense MANET Identification Protocol in different deployment scenarios,
with a number of nodes ranging from 50 to 550 (in steps of 20). The dimensions of
corresponding ES/IS were scaled so as to maintain the same density in all simulations.
They were set as follows:
| Number of nodes |
IS Side |
ES Side |
| 50 |
500 |
1000 |
| 70 |
592 |
1184 |
| 90 |
671 |
1342 |
| 110 |
721 |
1442 |
| 130 |
806 |
1612 |
| 150 |
866 |
1732 |
| 170 |
922 |
1844 |
| 190 |
975 |
1950 |
| 210 |
1025 |
2050 |
|
| Number of nodes |
IS Side |
ES Side |
| 230 |
1077 |
2144 |
| 250 |
1118 |
2236 |
| 270 |
1162 |
2324 |
| 290 |
1204 |
2208 |
| 310 |
1245 |
2490 |
| 330 |
1285 |
2570 |
| 350 |
1323 |
2646 |
| 370 |
1360 |
2720 |
| 390 |
1381 |
2792 |
|
| Number of nodes |
IS Side |
ES Side |
| 410 |
1432 |
2864 |
| 430 |
1466 |
2932 |
| 450 |
1500 |
3000 |
| 470 |
1533 |
3066 |
| 490 |
1565 |
3130 |
| 510 |
1599 |
3198 |
| 530 |
1628 |
3256 |
| 550 |
1658 |
3316 |
|
|
|
|
Participants were distributed so that the IS density was 8 time greater than the ES density.
This means that 65% ca. of participants was placed within the IS.
The number of neighbors required for belonging to the dense MANET was set to 11.
This value was experimentally obtained to make the dense MANET bounds almost coincide with
IS bounds.
Other parameters were set as follows:
| Paramter |
Value |
| Neighbor Limit |
11 |
| Discovery Delay |
5 s |
| Participant Advertise Interval |
20 s |
| Participant Advertise Delay |
5 s |
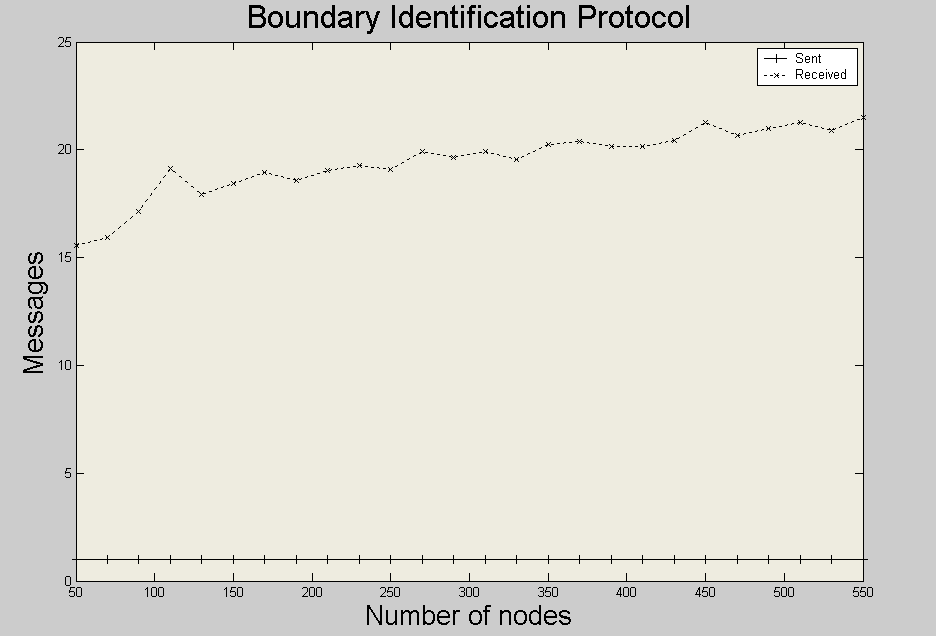
Next figure shows the average number of packets sent/received
by each participant, by considering all the different node densities.