ODT Implementation Detail and Experimental Results
|
ODT Implementation Detail and Experimental Results |
|
Bologna Open Data Portal The current version of the Bologna Open Data portal is a CMS website where datasets are stored as a list of files. These files consists mainly in CSV that containing data organized in tables and cartographic files, that files contain as shapes geographic informations of the city. The Bologna administration is interested in moving that CMS towards a more advanced portal where data can be linked with other content from different sources and provide a set of tool to help citizenship in exploring and exploiting data. To provide the administration with an example of the capabilities of this approach, we developed a complete boost process starting with a set of interesting use cases. In the following we will present two of them.
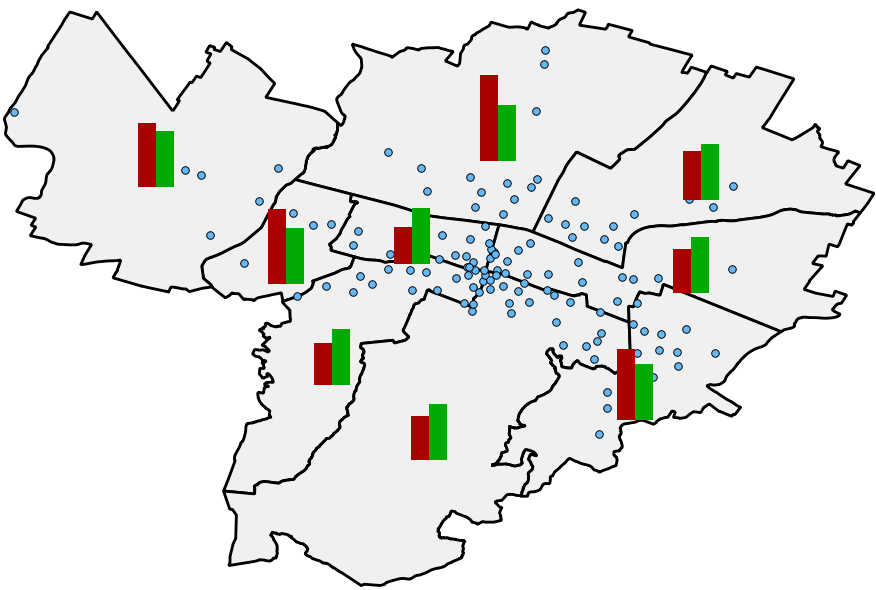
Analyzed Use Cases The first use case correlates population data - number of residents divided by age in different areas of the municipality - to the number of pharmacies and their positions in the same areas. We started from:
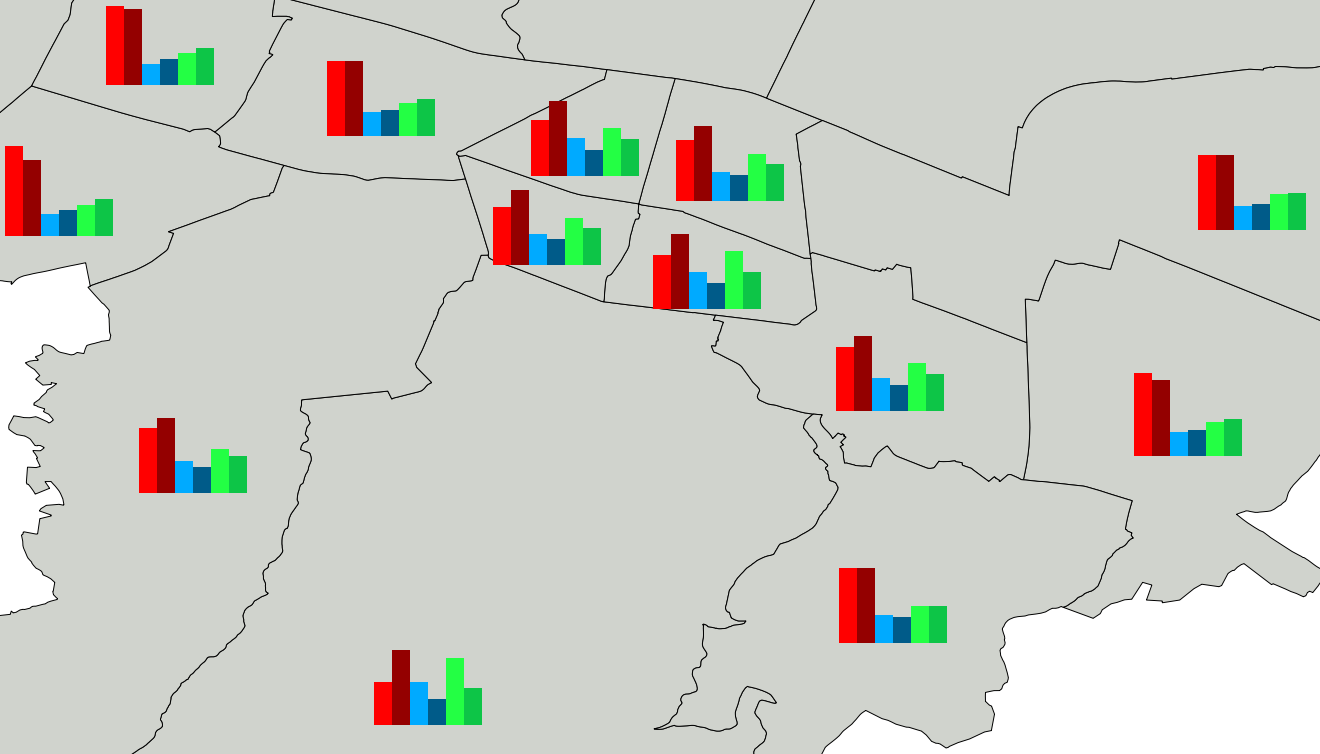
Once translated all those information through our tool chain into proper Linked Data, it is possible to create a SPARQL query that associates every pharmacy to a location on the map. That output was further joined with data about per-neighborhood population and that allowed to calculate the mean residents per pharmacy per neighborhood (see Fig. A). The second use case, instead, refers to national election of 2013 and correlates the poll results with age related and wage related informations. We started from:
both are available as CSV at the Bologna Open Data portal. Through the query is possible to aggregate data at a common level by the knowledge of the containment relations between neighborhood and voting area. Then through SPARQL queries it is possible to aggregate poll results for different parties by neighborhood, and compares the results with population data such as mean wage for the same area as showed in Fig. B. For the case of national election, we developed and make available also an interface that helps to construct a series of predetermined queries by using combo box selections. |
||
|
||
A. Pharmacy position in Bologna downtown (dots). The histogram bars represents the ratio between number of inhabitants and number of pharmacy per neighborhood (red bars) and in all city (green bars). The lines divide different city neighborhoods. |
||
 |
||
B. Electoral and Wage data comparison. Detail of Bologna city with comparison between different parties (first four bars) and mean wage (last two). Area mean are odd bars and city mean even bars.
|
||
|
||
| 20-mar-14 |